Case Study 1: Examples of Decision Analysis
Introduction and Learning Objectives
This case study is designed to get you familiar with constructing a decision tree in Excel. Specific learning objectives are as follows:
Parameterize and structure a decision tree model.
Estimate survival and cost outcomes from a decision tree model.
Overview of Decision Problem
Pulmonary embolism (PE) during pregnancy is a life-threatening event. Treatment with anti-coagulation is effective in preventing further PE and hence in reducing the fatality probability.
Anti-coagulation therapy, however, carries a risk of major bleeding (hemorrhage), which can also be fatal. Therefore, avoidance of anti-coagulation is preferred unless absolutely necessary.
Our primary objective is to estimate the expected costs and survival. We will consider a population of 100,000 pregnant women for whom the probability of an initial PE is 0.19. To reduce complexity, we will assume that all recurrent PE events result in death.
In addition,
- The cost of a fatal recurrent PE/hemorrhage event is 10,000.
- The cost of a nonfatal recurrent PE/hemorrhage event is 5,000.
We will consider two possible strategies to treat these women:
| Strategy | Costs | Health Effects |
|---|---|---|
| 1. Anticoagulant therapy | Cost of anticoagulant therapy = 1,000 | Probability of recurrent PE = 0.01 |
| Probability of fatal hemorrhage = 0.008 | ||
| 2. No Anticoagulant therapy | Probability of recurrent PE = 0.25 |
Excel-for-CEA: Assigning Variable Names
Assigning Variable Names
Our first step is to assign each base case value its variable name. There are two ways to do this:
- Using the naming box in the upper left of the spreadsheet. This is useful for naming one item at a time.
- Batch naming by using a table selection.
Let’s first run through option 1. In the figure below, we will assign the name “variable1” to the value in cell C5. We do this using the naming box highlighted in the upper left. Simply replace “C5” there with what you want to call the value in that cell, i.e., “variable1.”

You can see this process in action in the video below.
Batch Assigning Variable Names
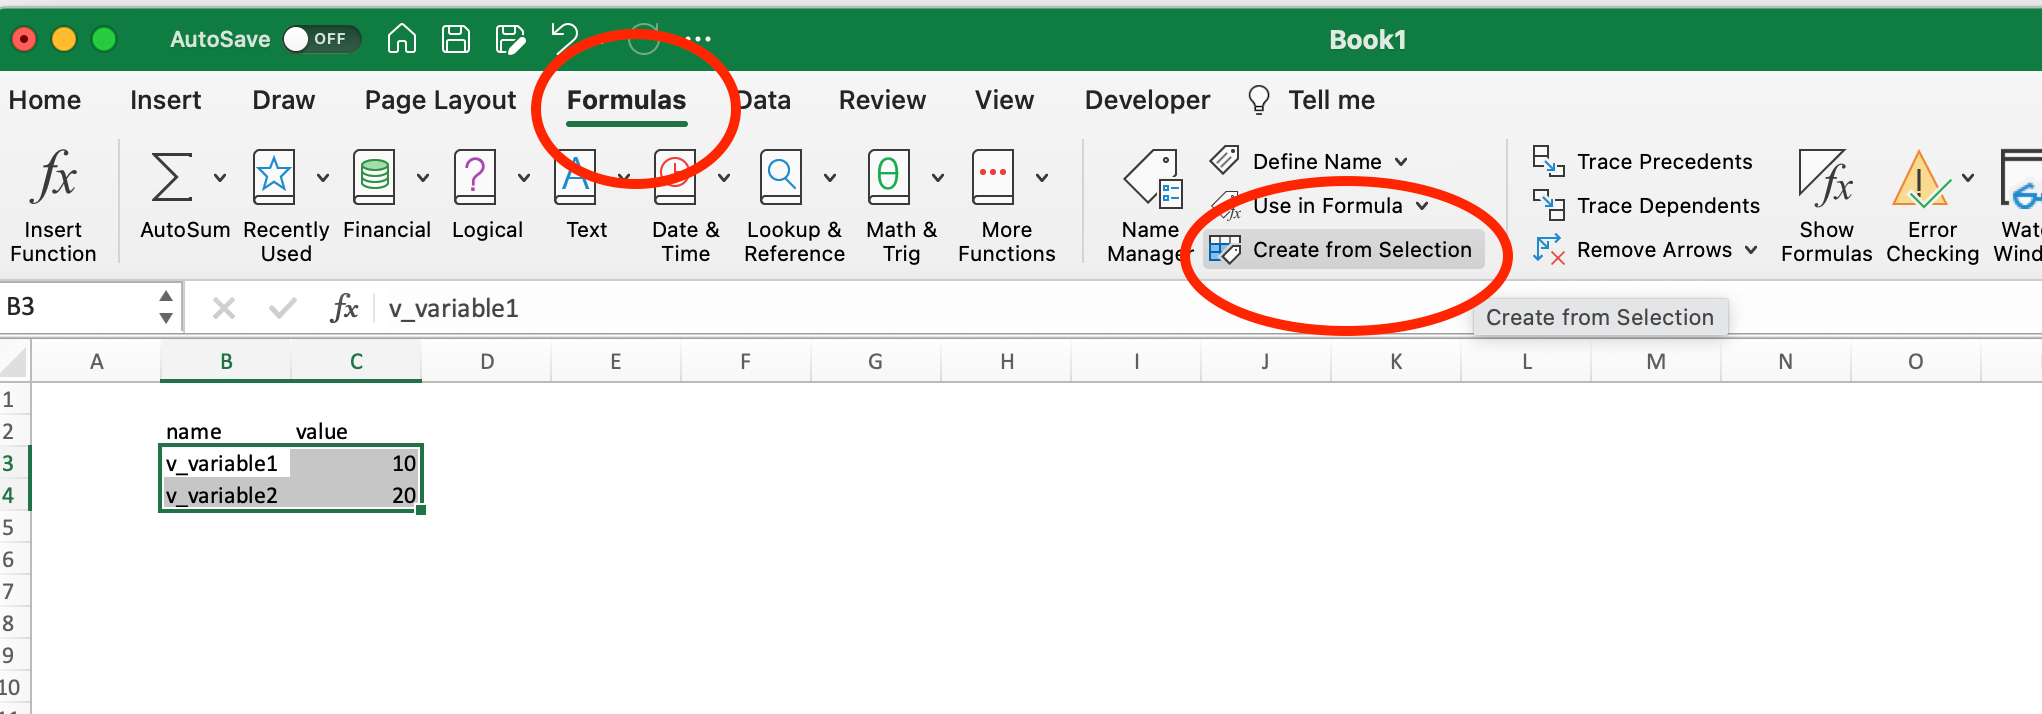
Often it is more efficient to assign groups of variables, rather than do it one by one. To do this we simply select the “table” we want to use, and then go to the Formulas tab and select Create from Selection.
Make sure the variable name you want to assign is either in the leftmost row, or the top row (see below). Also make sure the value you want assigned to that variable is in the second column, as shown in the figure.
Assuming you have structured your parameter table as above, and using the guidance above, when excel prompts you to “Create Names” you can tell it the variable names are in the left column:

Once you have done this, you can select the Name Manager on the Formulas ribbon to confirm the new names have been assigned, and to make changes.
You can edit, delete, or reassign the cell values/range in the Name Manager, too.

A video walk-through of this process is shown below.
If your parameter names are organized as column headers, you can use the same process, as shown in the video below.
Step 1: Parameterize the Decision Problem
The first worksheet you will find in the Excel case study is called “parameters.” This is the worksheet we will use to parameterize the decision tree:
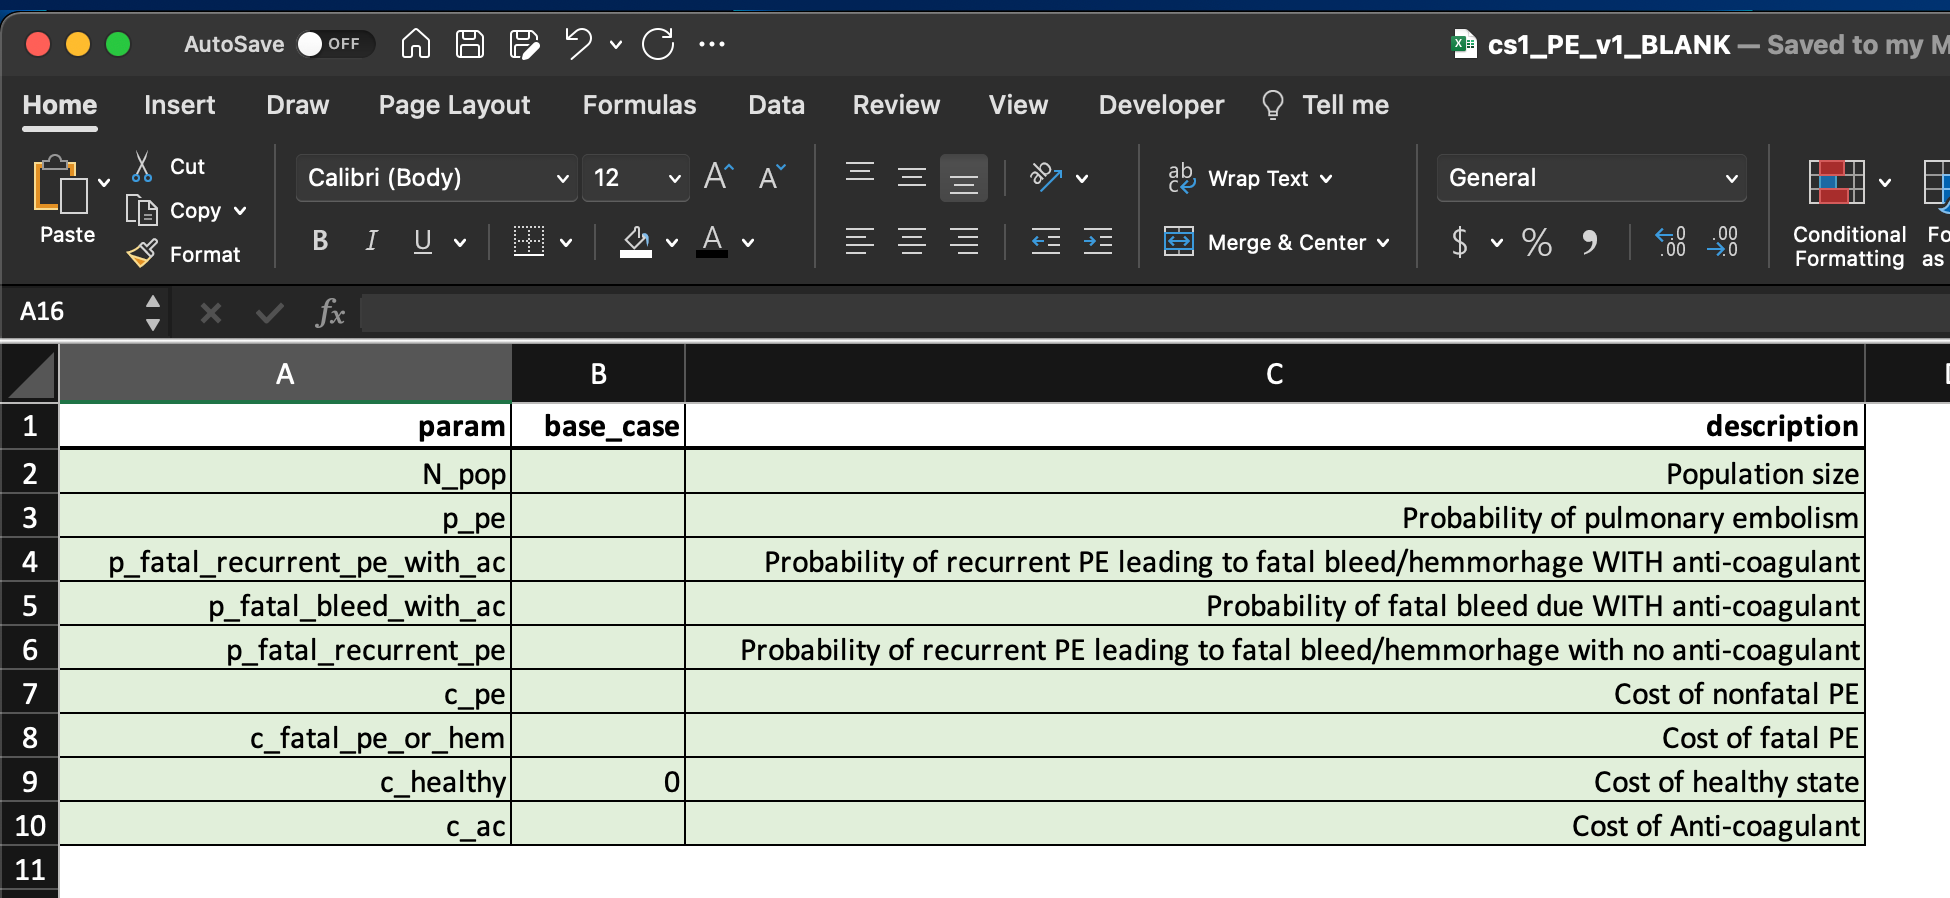
Relevant parameter names are already provided for you. However, we now need to fill in the base case values based on the information provided in the “Overview of Decision Problem” section above.
Use variable names to assign values to each parameter in the Excel document.
Step 2: Parameterize the Decision Tree
With our variable names defined we can now populate the tree, which you can find in the worksheet titled “Decision Tree” :

Underneath each branch of the tree you will see a blank box; this is where the parameter values will be placed:
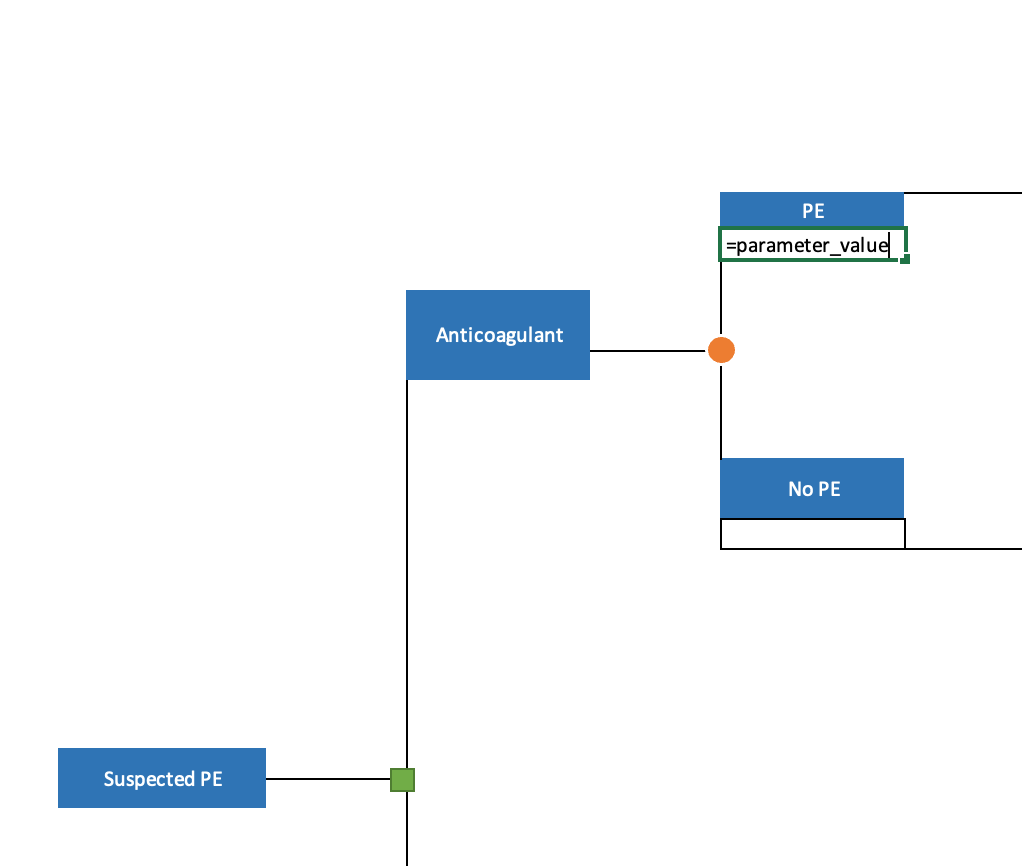
Parameterize the decision tree branches using the parameter names you defined in Exercise 1.1.
HINT: Some of the decision tree branches will require simple formulas based on the parameter variables. For example, survival is often calculated as (1-Pr(Death)).
Step 3: Calculate Outcomes for Each Tree Branch
Our next step is to calculate health and cost outcomes for each branch of the tree. On the far right you will notice three boxes:
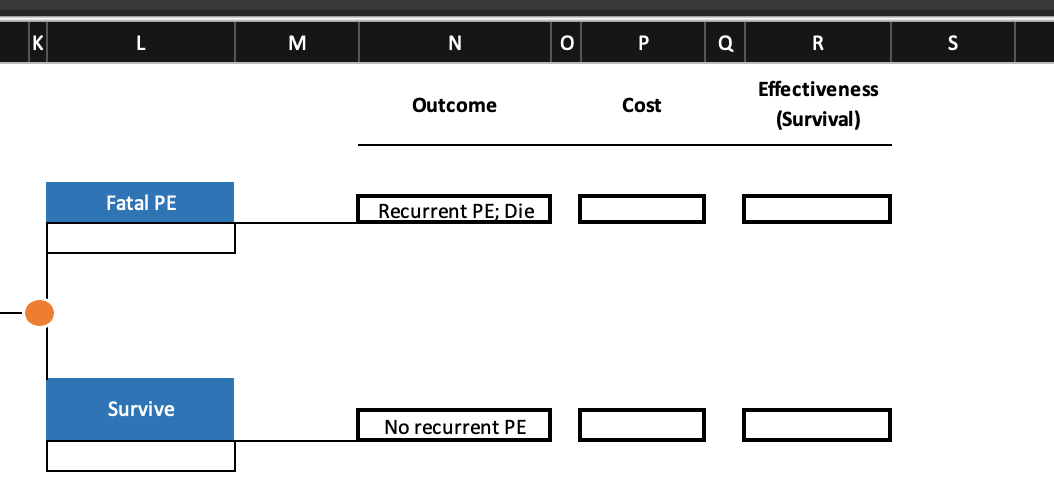
The Outcome column can be used to insert text that describes the outcome for that branch. For example, the first outcome is for a fatal recurrent PE event.
The Cost column tracks the total costs for an outcome event. In the above example, the cost column should be filled out to reflect the total cost of a fatal recurrent PE event in the event the woman receives anticoagulant therapy.
The Effectiveness (Survival) column tracks survival outcomes. For the purposes of this case study we are tracking only survival, not quality-adjusted life years. Therefore you can enter a value of “0” if the outcome for the given branch is death, and “1” if the outcome is survival.
Fill out the outcomes for each branch of the decision tree. For this exercise, you should fill out all three columns in each row.
Step 4: Calculate Expected Outcomes
Our final step is to “fold-back” the decision tree to summarize expected cost and survival outcomes for each strategy under consideration. You will find a summary table of outcomes in the worksheet titled “Summary.”

Calculate expected outcomes for each strategy.
HINT: For the expected deaths outcome, you can use the total population size and expected survival outcome.