1. Conceptual and theoretical frameworks for decision modeling
Learning Objectives and Outline
Learning Objectives
-Construct and solve a decision problem by calculating an intervention’s expected value across competing strategies in a decision tree
-Determine the decision threshold across a range of scenarios
-Differentiate between joint and conditional probabilities and demonstrate their use in decision trees
Outline
- Motivation
- Examples of Decision Analysis
- Structure Part 1: Decision Trees
- Basic Concepts in Decision Analysis
- Extending the Decision Modeling Toolkit
Motivation
The Past Two Decades …
- Cured Hepatitis C
- Significantly reduced incidence of HIV
- Potential cure for relapsed/refractory leukemia & lymphoma
- Perfected vaccines (e.g. HPV vaccine) to prevent diseases such as cervical & other cancers
- Strides in preventing cardiovascular disease
Examples of Decision Analyses
Ex 1. HIV
You have been appointed as Director of a funding allocation committee responsible for prevention & treatment initiatives for HIV.
How will the committee decide on the proportion of funds for prevention efforts versus treatment?
Should any of the funds be used for research?
How do you respond to a member who argues that the funds are better spent on childhood vaccinations?
Ex 2. Birth Defects
A hypothetical birth defect is present in every 1 in 1,000 children born
Unless treated, this condition has a 50% fatality rate
Ex 2. Birth Defects
Should we test for this hypothetical birth defect?
A hypothetical birth defect is present in every 1 in 1,000 children born.
Unless treated, this condition has a 50% fatality rate.
Ex 2. Birth Defects
Should we test for this hypothetical birth defect?
Diagnostic test: Perfectly accurate
All newborns in whom the defect is identified can be successfully cured
BUT the test itself can be lethal:
- 4 in every 10,000 infants tested will die as a direct and observable result of the testing procedure
Ex 2. Birth Defects
Objective: Minimize total expected deaths
Ex 2. Birth Defects
Objective: Minimize total expected deaths
Consider a population of 100,000 newborns
Testing produces: (0.0004 x 100,000) = 40 expected deaths
No testing produces: (0.001 x 0.5 x 100,000) = 50 expected deaths
Ex 2. Birth Defects
Objective: Minimize total expected deaths
Consider a population of 100,000 newborns
Testing produces: (0.0004 x 100,000) = 40 expected deaths
No testing produces: (0.001 x 0.5 x 100,000) = 50 expected deaths
Looks like TESTING WINS!
Ex 2. Birth Defects
Objective: Minimize total expected deaths
Consider a population of 100,000 newborns
Testing produces: (0.0004 x 100,000) = 40 expected deaths
No testing produces: (0.001 x 0.5 x 100,000) = 50 expected deaths
Looks like TESTING WINS!
Anyone got a problem with this??
Different lives are lost
With testing, virtually all 40 deaths occur in infants born without the fatal condition.
With no testing, all 50 expected deaths occur from “natural causes” (i.e. unpreventable birth defect)
Different lives are lost
“Innocent deaths” inflicted on children who had “nothing to gain” from testing program
We may treat one child’s death as more tolerable than some other’s – even when we have no way, before the fact, of distinguishing one infant from the other.
Ex 3. Colon Cancer
- 3rd leading cause of cancer death.
- Men, women, all races.
- Early detection aids in prevention & improves health outcomes .
- \(\sim80\%\) preventable.
Ex 3. Colon Cancer – Prevention
- When to screen?
- Which test & how often?
- If a polyp is found/removed, when to repeat?
Ex 3. Colon Cancer – Prevention
- Cost-effectiveness of alternative screening tests?
- Alternative frequencies of screening?
- How should screening vary by risk groups?
Ex 3. Colon Cancer - Estimating Probabilities
- Predict colon cancer risk/incidence
- Family history, past polyps, other factors
- Probability of getting colon cancer
- Predict impact from colon cancer
- Probability of cure
- Probability of death
- Probability of morbidity
Ex 3. Colon Cancer - Estimating Probabilities
- Predict “benefit” from screening
- All previous probabilities
- Probability of early detection
- Probability of complication from testing
- Probability of false positive
- Probability of false negative
- Probability of positive tests = cancer
- Probability of negative test = no cancer
Estimating probabilities is fundamental to decision making
- Cannot readily obtain needed probabilities
- Varying time periods / lengths
- Methods to estimate probabilities
Commonality of cases
- Unavoidable tradeoffs
- Different perspectives may lead to different conclusions
- Multiple competing objectives
- Complexity
- Uncertainty
Decision Analysis
Aims to inform choice under uncertainty using an explicit, quantitative approach
Aims to identify, measure, & value the consequences of decisions + uncertainty when a decision needs to be made, most appropriately over time.
The Structure of a Decision Analysis
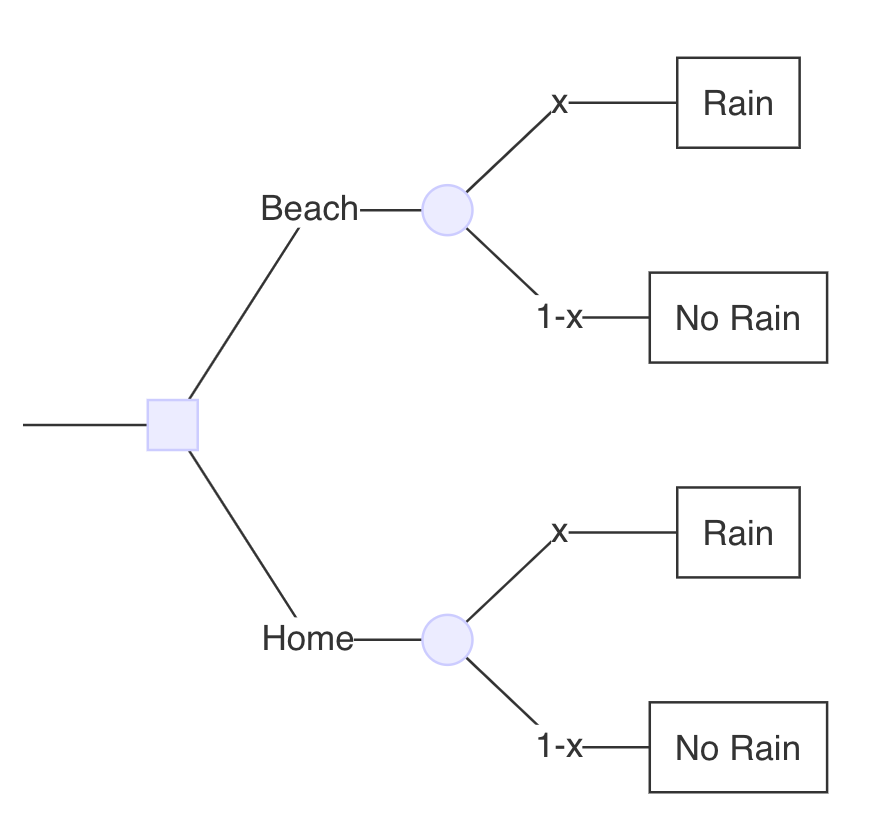
Should I go to the beach or stay home?
Should I go to the beach or stay home?
Possible States of the World:
- At the beach with no rain.
- At the beach with rain.
- At home with no rain.
- At home with rain.
Should I go to the beach or stay home?
Considerations:
- Likelihood of rain.
- My overall well being when
- At the beach with no rain.
- At the beach with rain.
- At home with no rain.
- At home with rain.
Should I go to the beach or stay home?
Considerations:
- Likelihood of rain –> probabilities
- My overall well being when
- At the beach with no rain.
- At the beach with rain.
- At home with no rain.
- At home with rain.
Should I go to the beach or stay home?
Considerations:
- Likelihood of rain –> probabilities
- My overall well being when
- At the beach with no rain. –> payoff
- At the beach with rain. –> payoff
- At home with no rain. –> payoff
- At home with rain. –> payoff
Decision Trees
Decision Trees
- A square decision node indicates a decision point between alternative options.
- A circular chance node shows a point where two or more alternative events for a patient are possible.
Decision Trees
- A square decision node indicates a decision point between alternative options.
- A circular chance node shows a point where two or more alternative events for a patient are possible.

Decision Trees
- Pathways are mutually exclusive sequences of events and are the routes through the tree.
- Probabilities show the likelihood of particular event occurring at a chance node.
Should I go to the beach or stay home?
Decision Tree:
Probability of rain = 30%
Should I go to the beach or stay home?
Decision Tree:
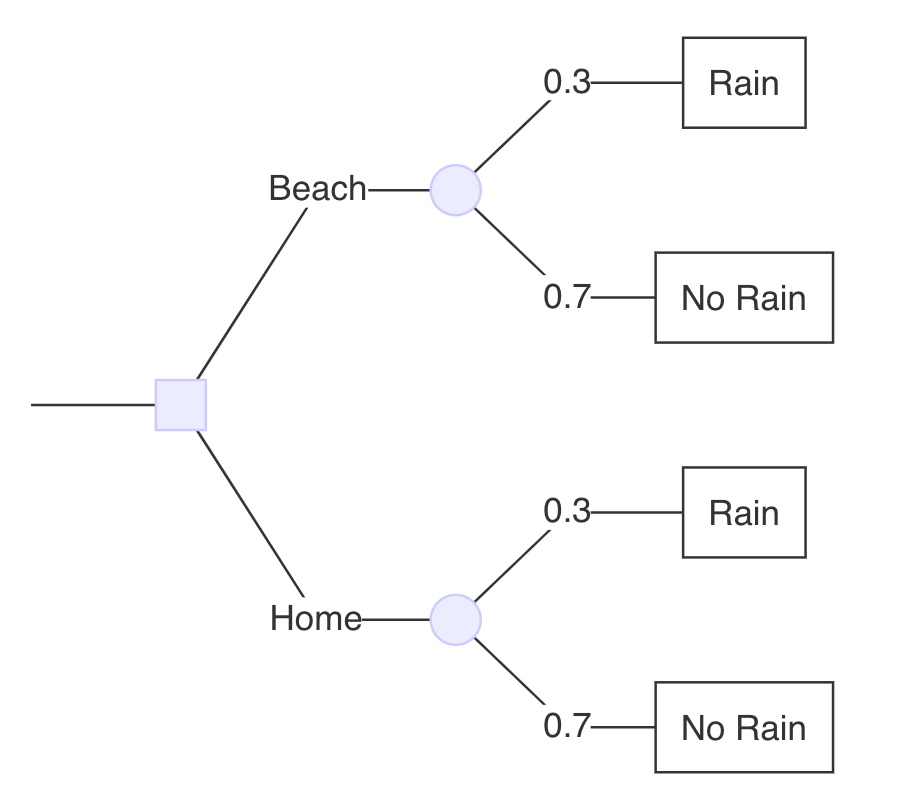
Should I go to the beach or stay home?
Payoffs
| Scenario | Payoff |
|---|---|
| At beach, no rain | 1.0 |
| At beach, rain | 0.4 |
| At home, no rain | 0.8 |
| At home, rain | 0.6 |
Should I go to the beach or stay home?
Decision Tree:
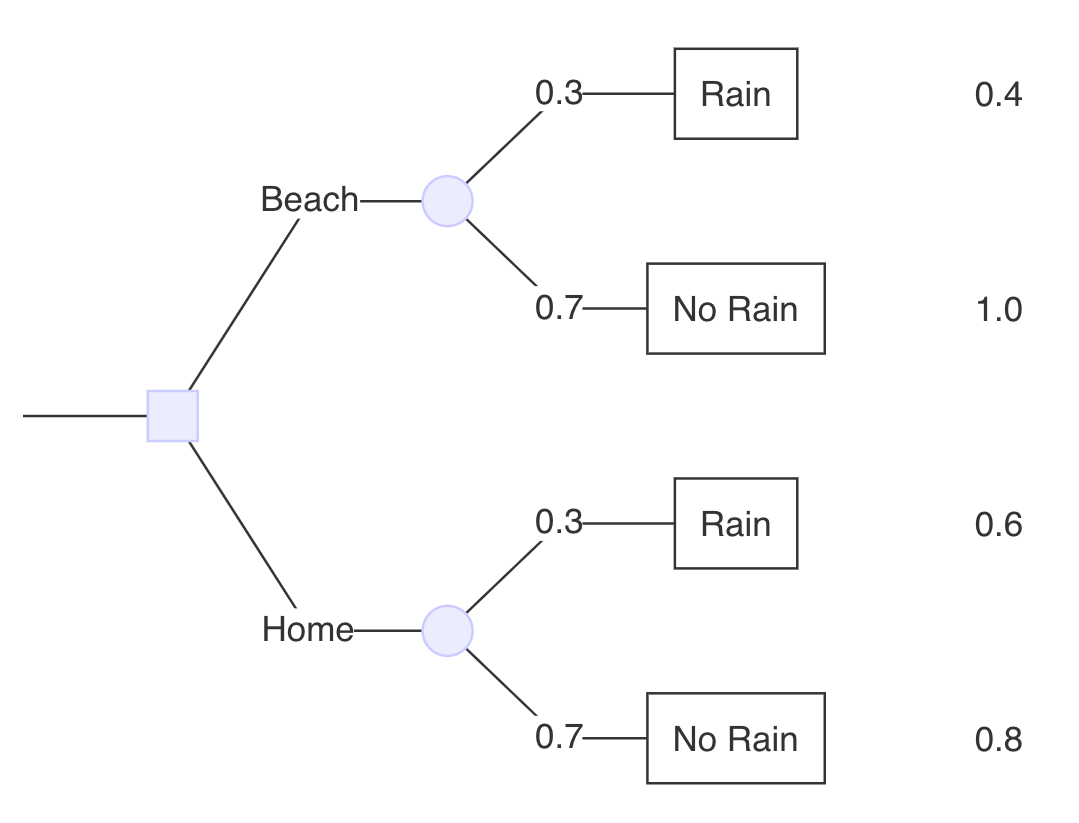
What is the expected value of going to the beach?
\(\color{green}{0.82} = \underbrace{\color{red}{0.3} \cdot \color{blue}{0.4}}_{\text{Rain}} + \underbrace{\color{red}{0.7} \cdot \color{blue}{1.0}}_{\text{No Rain}}\)
- Probabilities in red.
- Payoffs in blue.
- Expected value in green.
What is the expected value of staying home?
\(\color{green}{0.74} = \underbrace{\color{red}{0.3} \cdot \color{blue}{0.6}}_{\text{Rain}} + \underbrace{\color{red}{0.7} \cdot \color{blue}{0.8}}_{\text{No Rain}}\)
- Probabilities in red.
- Payoffs in blue.
- Expected value in green.
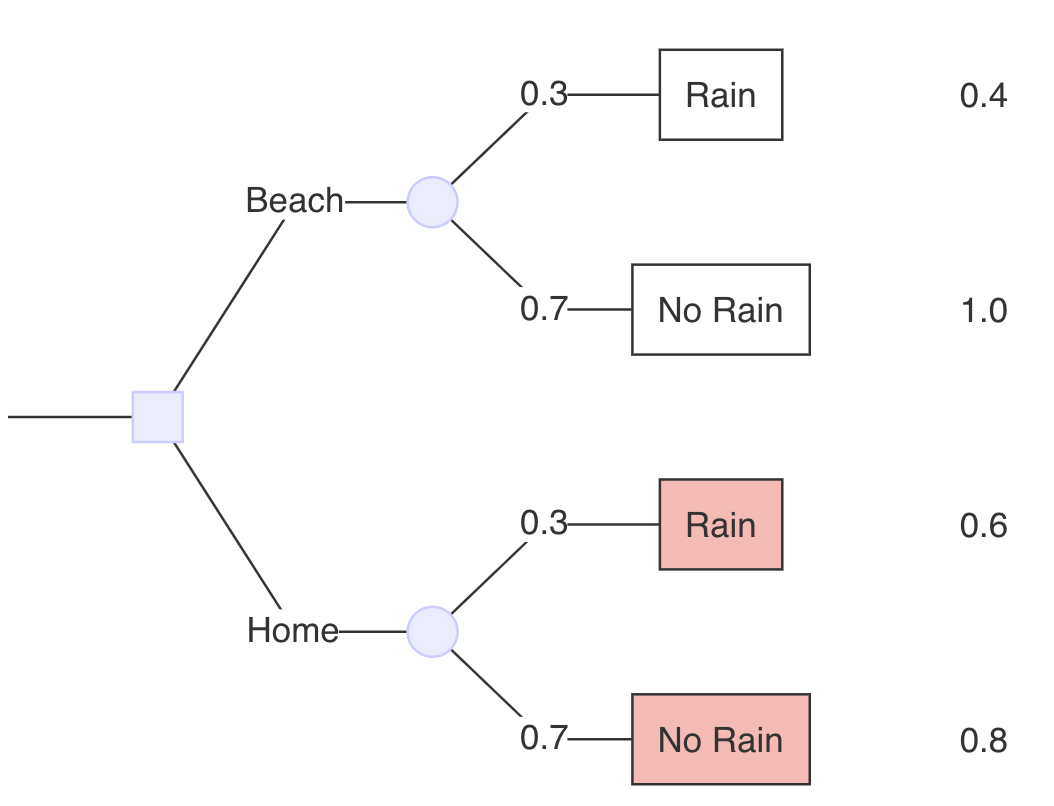
Beach
EV(Beach)=0.82 > EV(Home)=0.74
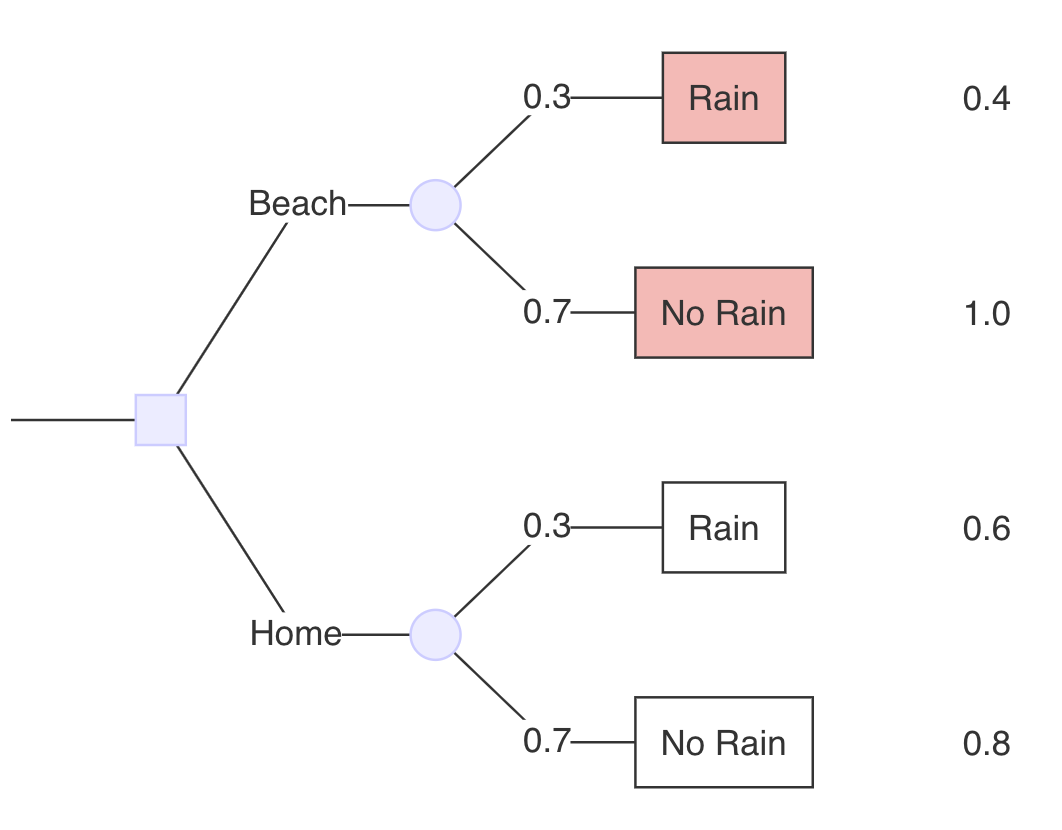
Determining the Decision Threshold
At what probability \(p\) are the two choices equal?
Write the equation for each choice using a variable, p, for the probability in question
Set the equations equal to to one other and solve for p.
At what probability \(p\) are the two choices equal?
Beach: 0.82 = 0.3 x 0.4 + 0.7 x 1.0
Home: 0.74 = 0.3 x 0.6 + 0.7 x 0.8
At what probability \(p\) are the two choices equal?
\(\underbrace{0.3 * 0.4 + 0.7 * 1.0}_{\text{Beach}} = \underbrace{0.3 * 0.6 + 0.7 * 0.8}_{\text{Home}}\)
At what probability \(p\) are the two choices equal?
Replace probabilities with P and 1-P and solve for “P”
p * 0.4 + (1-p) * 1.0 = p * 0.6 + (1-p) * 0.8
\(\underbrace{0.3 * 0.4 + 0.7 * 1.0}_{\text{Beach}} = \underbrace{0.3 * 0.6 + 0.7 * 0.8}_{\text{Home}}\)
At what probability \(p\) are the two choices equal?
p * 0.4 + (1-p) * 1.0 = p * 0.6 + (1-p) * 0.8
At what probability \(p\) are the two choices equal?
p * 0.4 + (1-p) * 1.0 = p * 0.6 + (1-p) * 0.8
0.4p + 1-p = 0.6p + 0.8 - 0.8p
1-0.6p = 0.8 - 0.2p
1-0.8 = 0.6p - 0.2p
0.2 = 0.4 * p
0.5 = p
At what probability \(p\) are the two choices equal?
When the probability of rain is 50% at BOTH the beach and home, given how we weighted the outcomes, going to the beach would be the same as staying at home
In other words, you would be indifferent between the two – staying at home or going to the beach
At what probability (\(p_B\)) of rain for the beach are you indifferent between the two options?
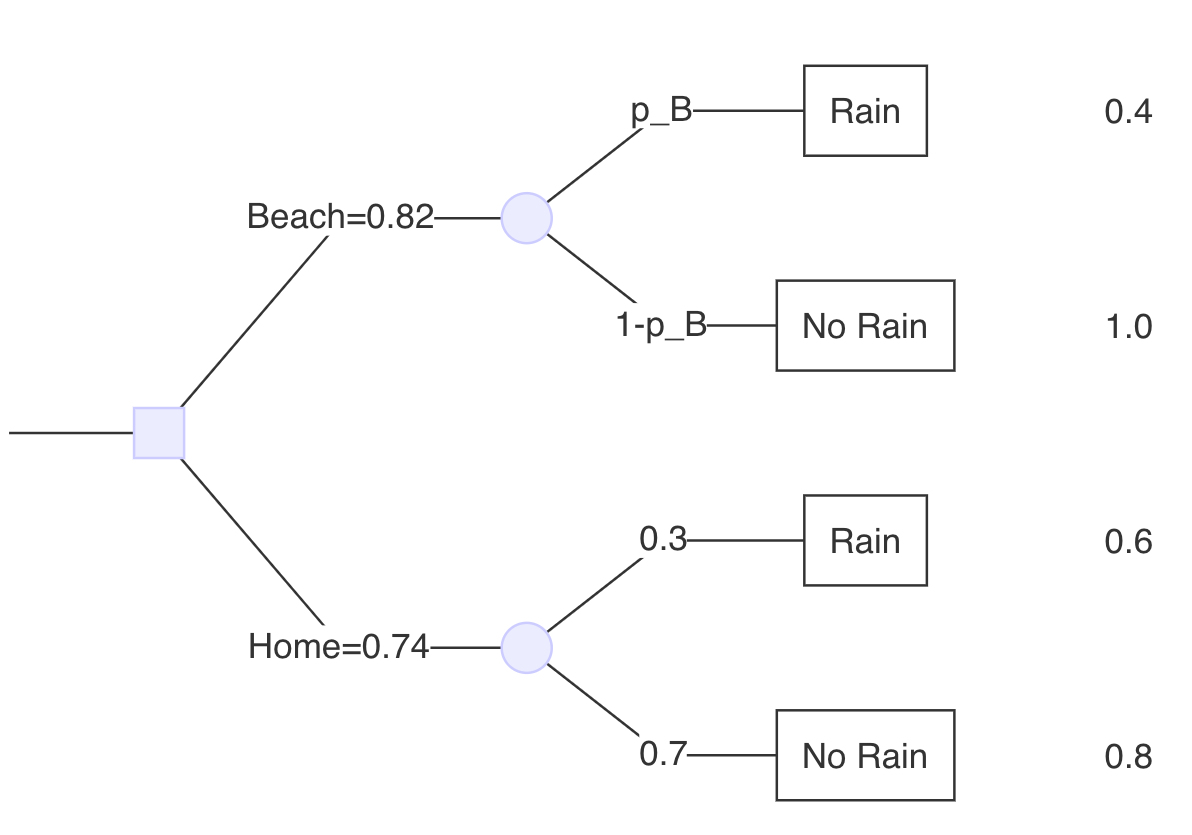
At what probability (\(p_B\)) of rain for the beach are you indifferent between the two options?
Earlier, we solved for the expected payoff of remaining at home: 0.74
What would \(p_B\) need to be to yield an expected payoff at the beach of 0.74?
At what probability (\(p_B\)) of rain for the beach are you indifferent between the two options?
Set 0.74 (expected value of remaining at home) equal to the beach payoffs and solve for \(p_B\)
pB * 0.4 + (1 - pB) * 1.0 = 0.74
At what probability (\(p_B\)) of rain for the beach are you indifferent between the two options?
pB * 0.4 + (1 - pB) * 1.0 = 0.74
pB * 0.4 + 1 - p~B = 0.74
At what probability (\(p_B\)) of rain for the beach are you indifferent between the two options?
pB * 0.4 + 1 - p~B = 0.74
pB * -0.6 = -0.26
At what probability (\(p_B\)) of rain for the beach are you indifferent between the two options?
pB * -0.6 = -0.26
pB = -0.26 / -0.6 = 0.43
At what probability (\(p_B\)) of rain for the beach are you indifferent between the two options?
When the probability of rain at the beach is 43% (probability of rain at home remains at 30%), we would be indifferent between staying at home & going to the beach.
If the probability of rain at the beach in > 43%, then we would stay home
Basic Concepts in Decision Analysis
Probabilities
The likelihood of an event taking place in the future.
Joint probability
P(A and B): The probability of two events occurring at the same time.
Conditional probability
P(A|B): The probability of an event A given that an event B is known to have occurred.
Probabilities
- Moving from left to right, the first probabilities in the tree show the probability of an event.
- Subsequent probabilities are conditional.
- The probability of an event given that an earlier event did or did not occur.
- Multiplying probabilities along pathways estimates the pathway probability, which is a joint probability.
Expected Values
- The result that is expected on the average for any one decision alternative (e.g. length of life, quality of life, lifetime costs)
- On average, patients given Treatment A will live 0.30 years longer than patients given Treatment B
Expected Values
- The result that is expected on the average for any one decision alternative (e.g. length of life, quality of life, lifetime costs)
- On average, patients given Treatment A will live 0.30 years longer than patients given Treatment B
Maximizing expected value is a reasonable criterion for choice given uncertain prospects; though it does not necessarily promise the best results for any one individual.
Decision Philosophies
Maximizing expected value is a reasonable criterion for choice given uncertain prospects; though it does not necessarily promise the best results for any one individual.
Mini-max regret
Maxi-max
Expected utility
Decision Philosophies
Maximizing expected value is a reasonable criterion for choice given uncertain prospects; though it does not necessarily promise the best results for any one individual.
Mini-max regret
- Never go to the beach unless 0% rain.
Maxi-max
Expected utility
Decision Philosophies
Maximizing expected value is a reasonable criterion for choice given uncertain prospects; though it does not necessarily promise the best results for any one individual.
- Mini-max regret
- Never go to the beach unless 0% rain.
- Maxi-max
- Always go to the beach unless 100% rain.
- Expected utility
- Depends on the weather.
Payoffs
- Each state of the world is assigned a cost or outcome.
- Our goal is often to calculate the expected value of these payoffs.
- We’ll cover more on the theories and frameworks underlying various payoffs in the next lecture.
Extending the Decision Modeling Toolkit
Extending the Decision Modeling Toolkit
- Decision trees are a powerful framework for analyzing decisions, but they have limitations.
- No explicit accounting for the elapse of time.
- Recurrent events must be separately built into model.
- Fine for short time cycles (e.g., 12 months) but we often want to model over a lifetime.
- Tree structure can quickly become complex.
- Over longer time horizons, death is a competing risk.
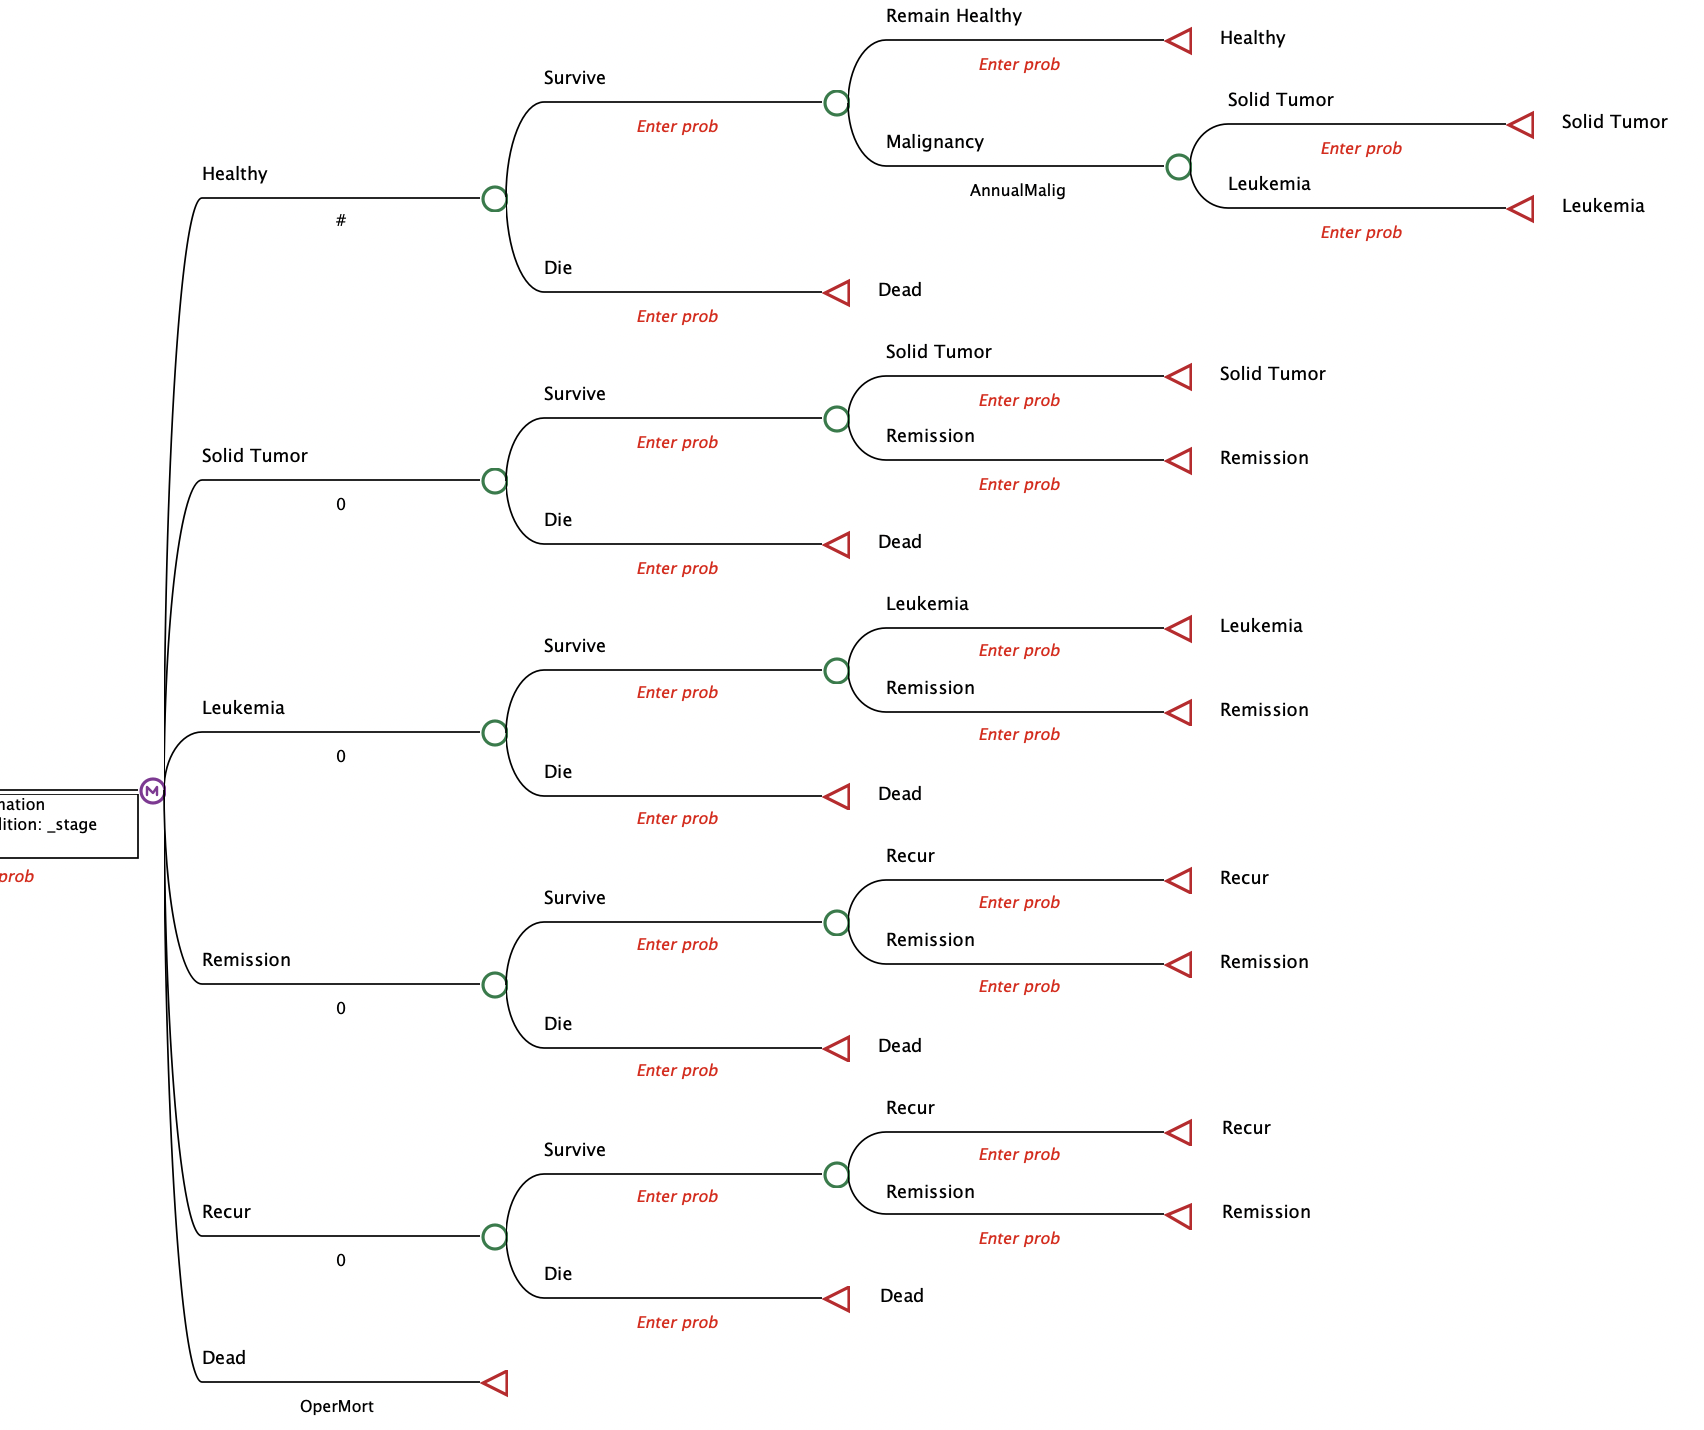
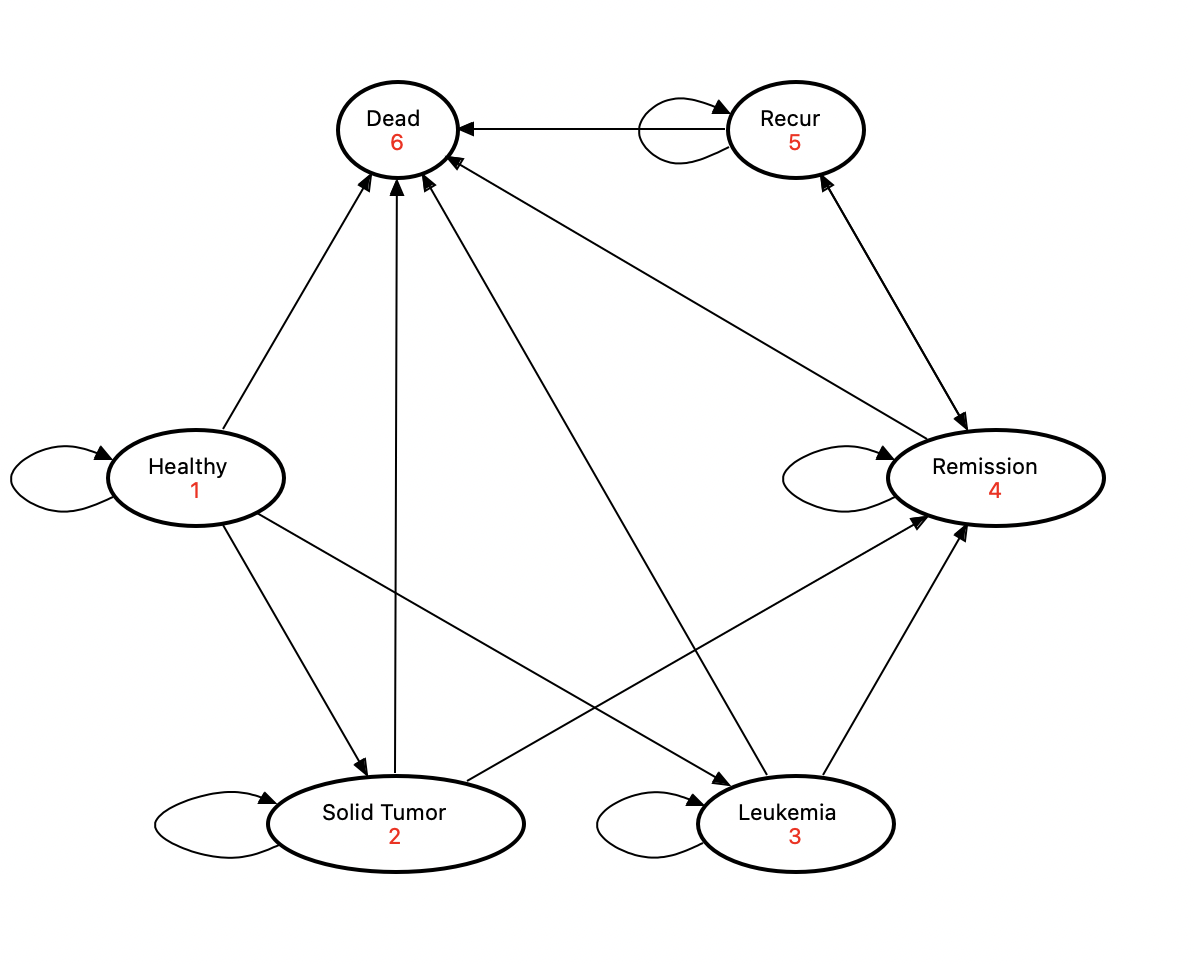
Cohort-Level Simulation Models: Markov Models
- Markov models can handle some of the increased complexity.
- Can model the experience of population cohort over time, as they transition among mutually exclusive states.
Cohort-Level Simulation Models: Markov Models
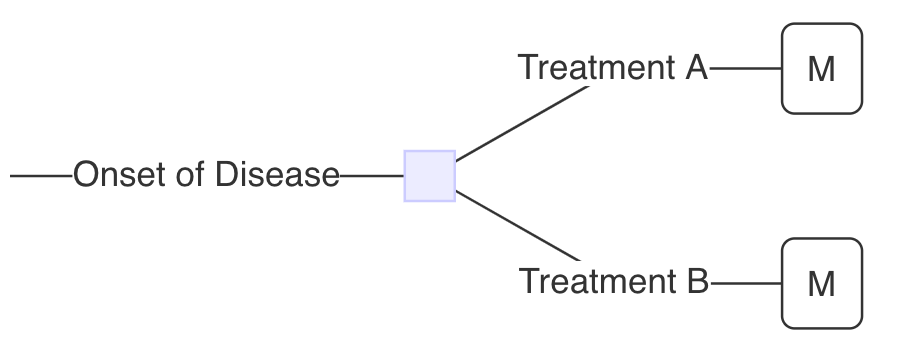
Decision Tree and Markov Model: Treatment A
Treatment A: 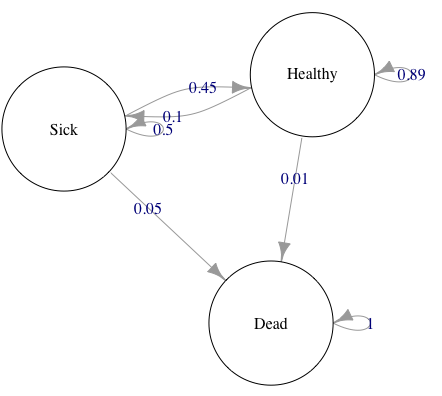
Decision Tree and Markov Model: Treatment B
Treatment B: 
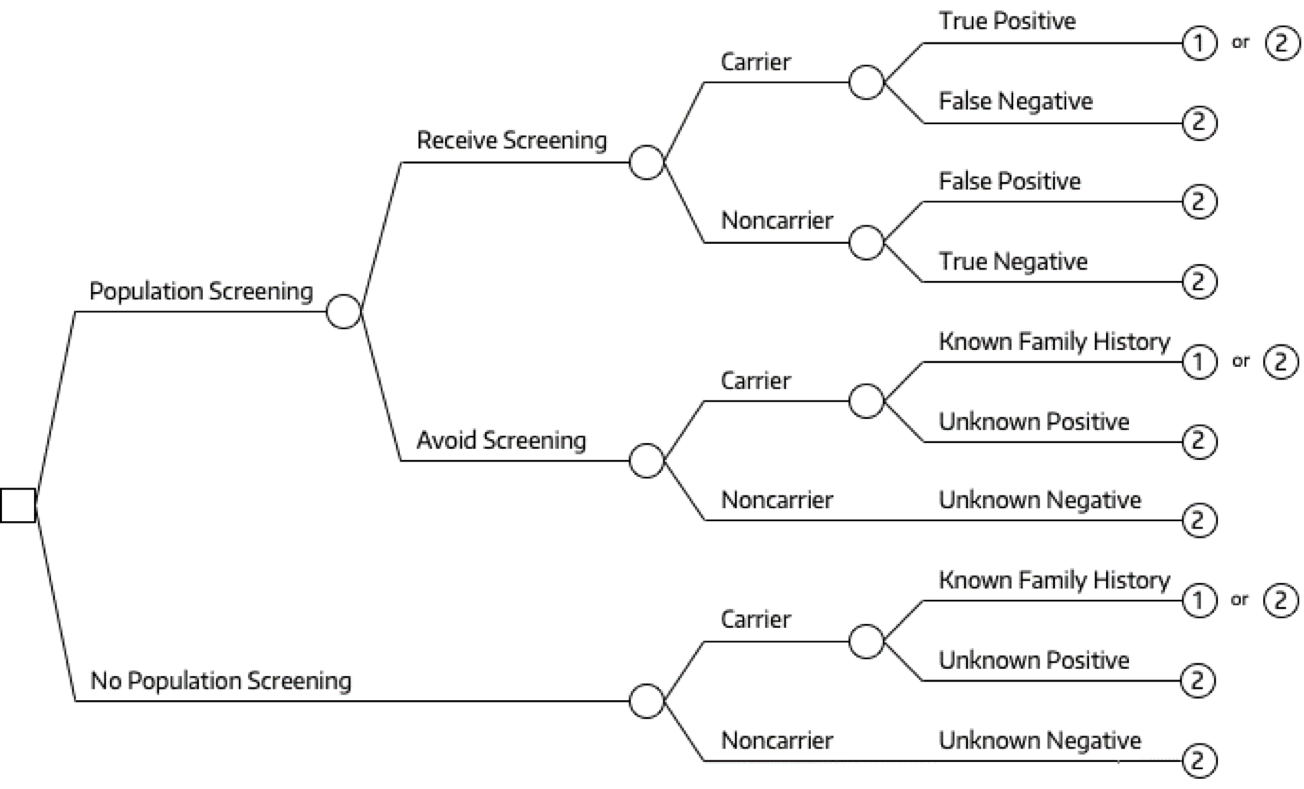
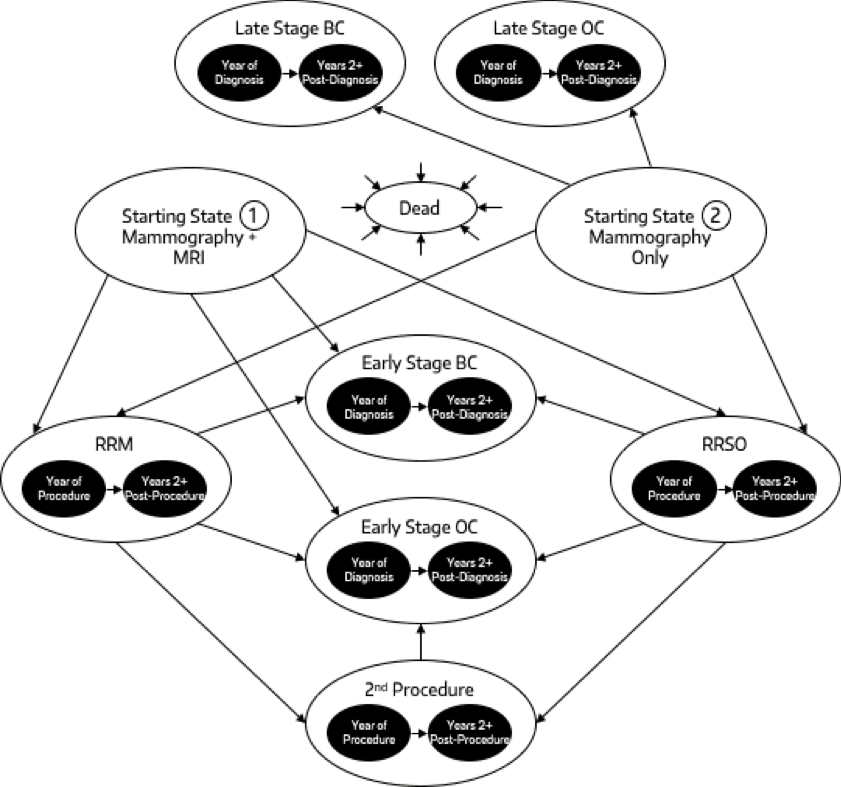
Decision Tree: Guzauskas et. al (2022)
Decision Tree and Markov Model: Guzauskas et. al (2022)
Another example: Decision Tree and Markov Model
Another example: Decision Tree and Markov Model
Patient-Level Simulation Models: Microsimulation
- Simulates a single individual changing health states
- Fixed finite time step; estimates averages and standard deviations
- Relies on random probability draws
- Convergence is important – For microsimulation models, you must simulate many more individuals to reach convergence (compared to DES, for example)
Patient-Level Simulation Models: Discrete Event Simulation
Source: (Caro et al. 2015)
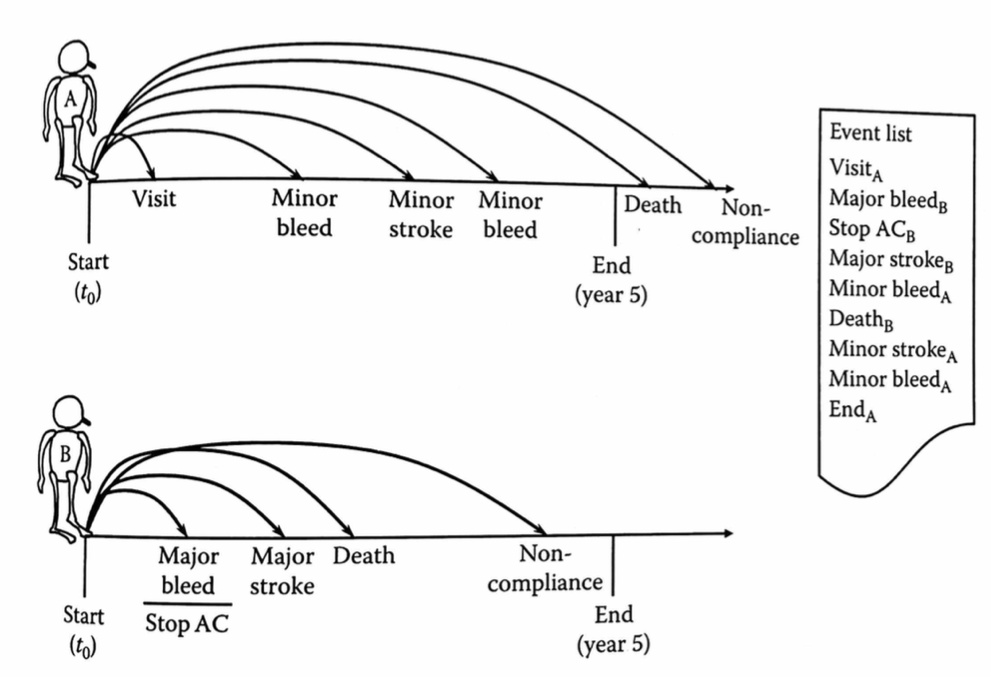
Patient-Level Simulation Models: Discrete Event Simulation
- Simulates a single individual changing health states (& do this for many individuals)
- Relies on random probability draws
- Continuous model = higher resolution of events (unlike microsimulation, which truncates random distributions)
- Great flexibility for handling resource limitations