2. Foundations of economic evaluation
Economic Evaluation
Relevant when decision alternatives have different costs and health consequences.
We want to measure the relative value of one strategy in comparison to others.
This can help us make resource allocation decisions in the face of constraints (e.g., budget).
Cost-Benefit Analysis
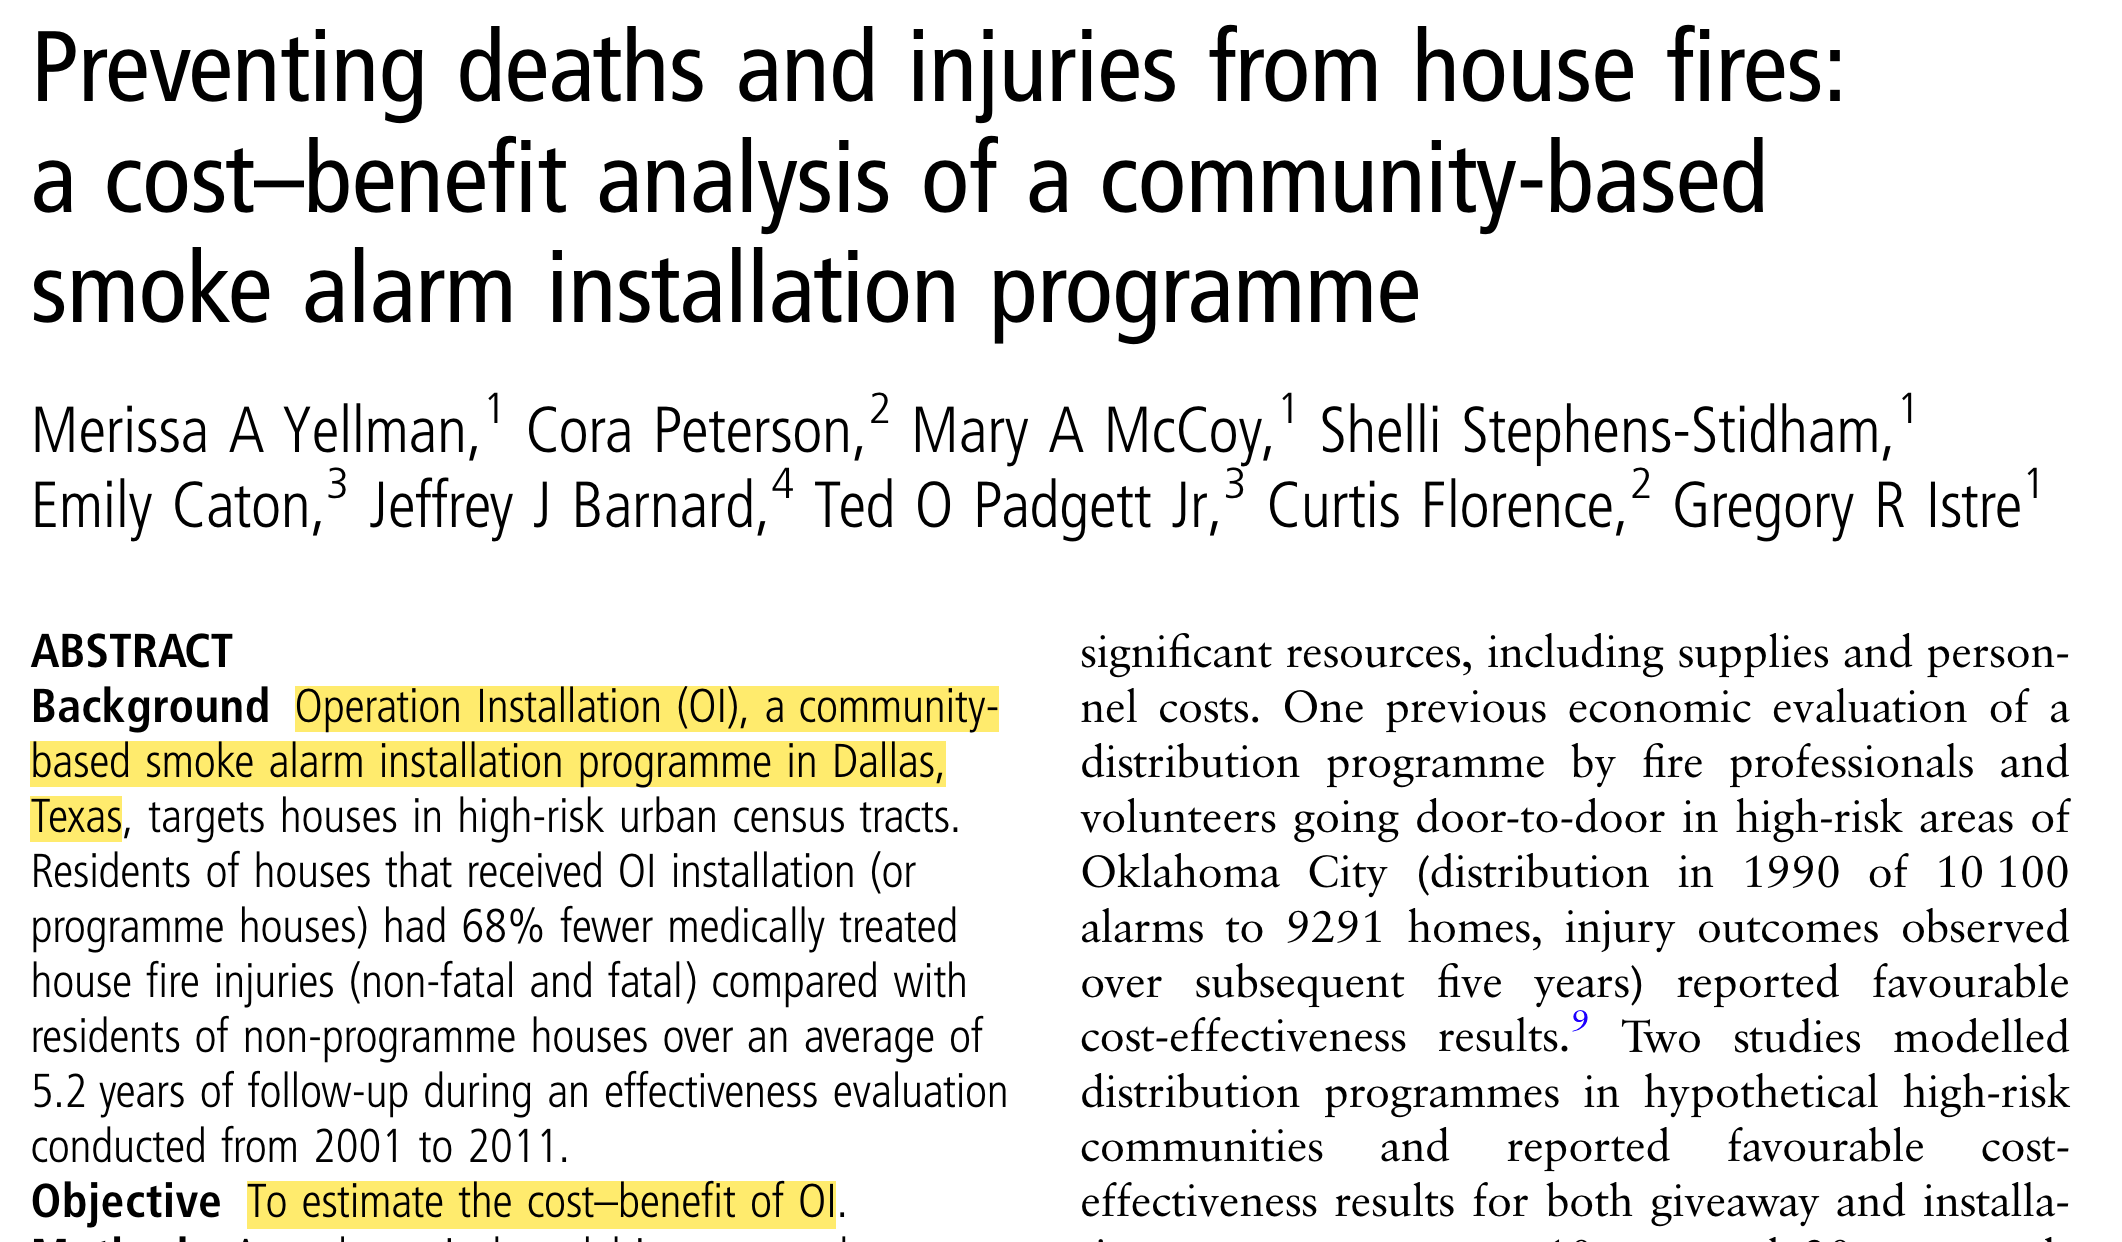
https://pubmed.ncbi.nlm.nih.gov/28183740/
Cost-Benefit Analysis
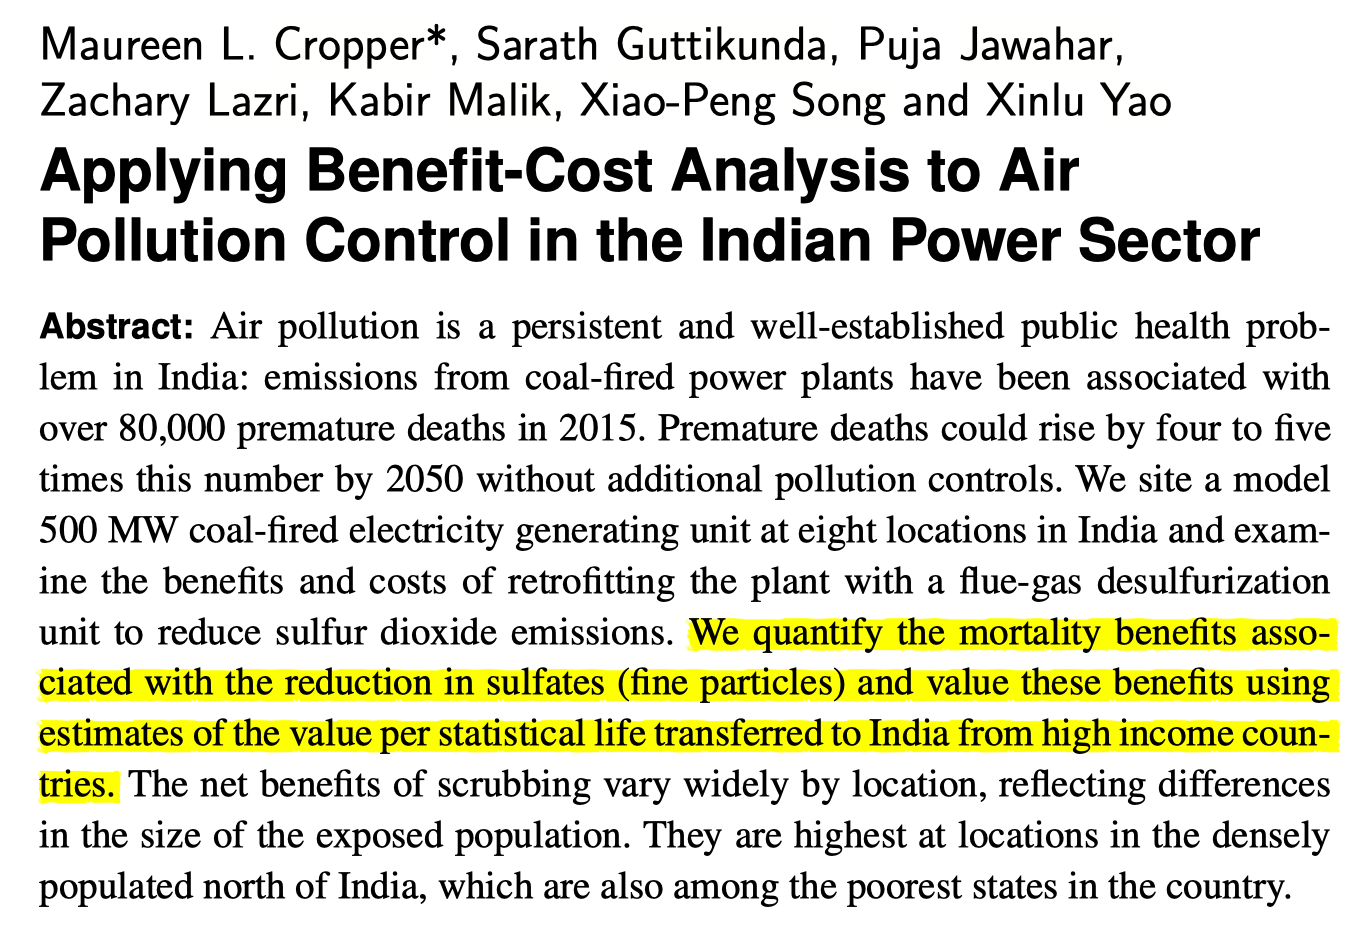
https://www.cambridge.org/core/product/identifier/S2194588818000271/type/journal_article
QALYs
Origin story: welfare economics
- Utility = holistic measure of satisfaction or wellbeing
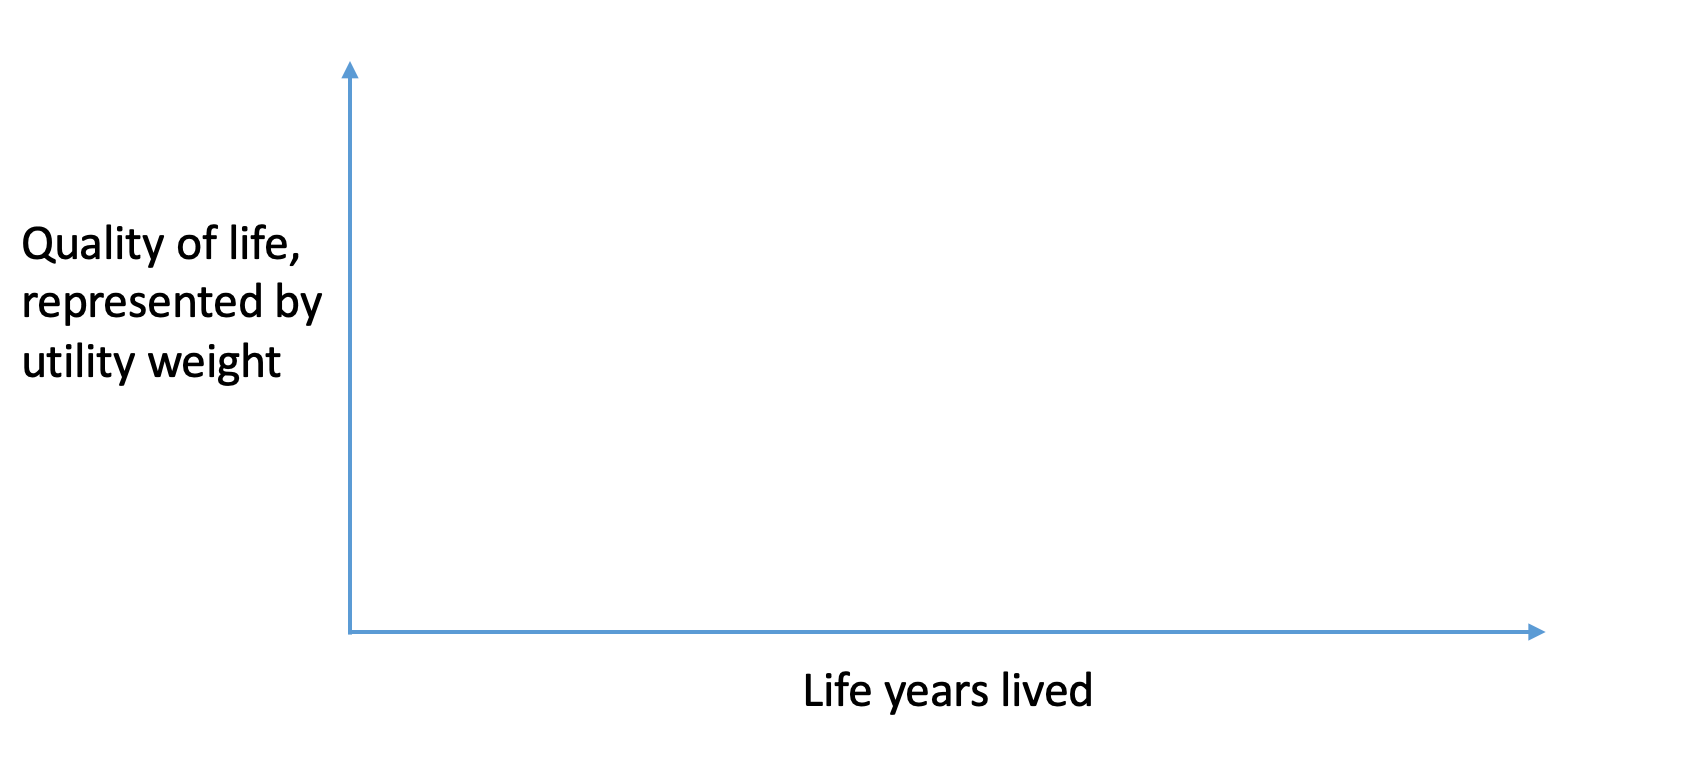
With QALYs, two dimensions of interest:
length of life (measured in life-years)
quality of life (measured by utility weight, usually between 0 and 1)
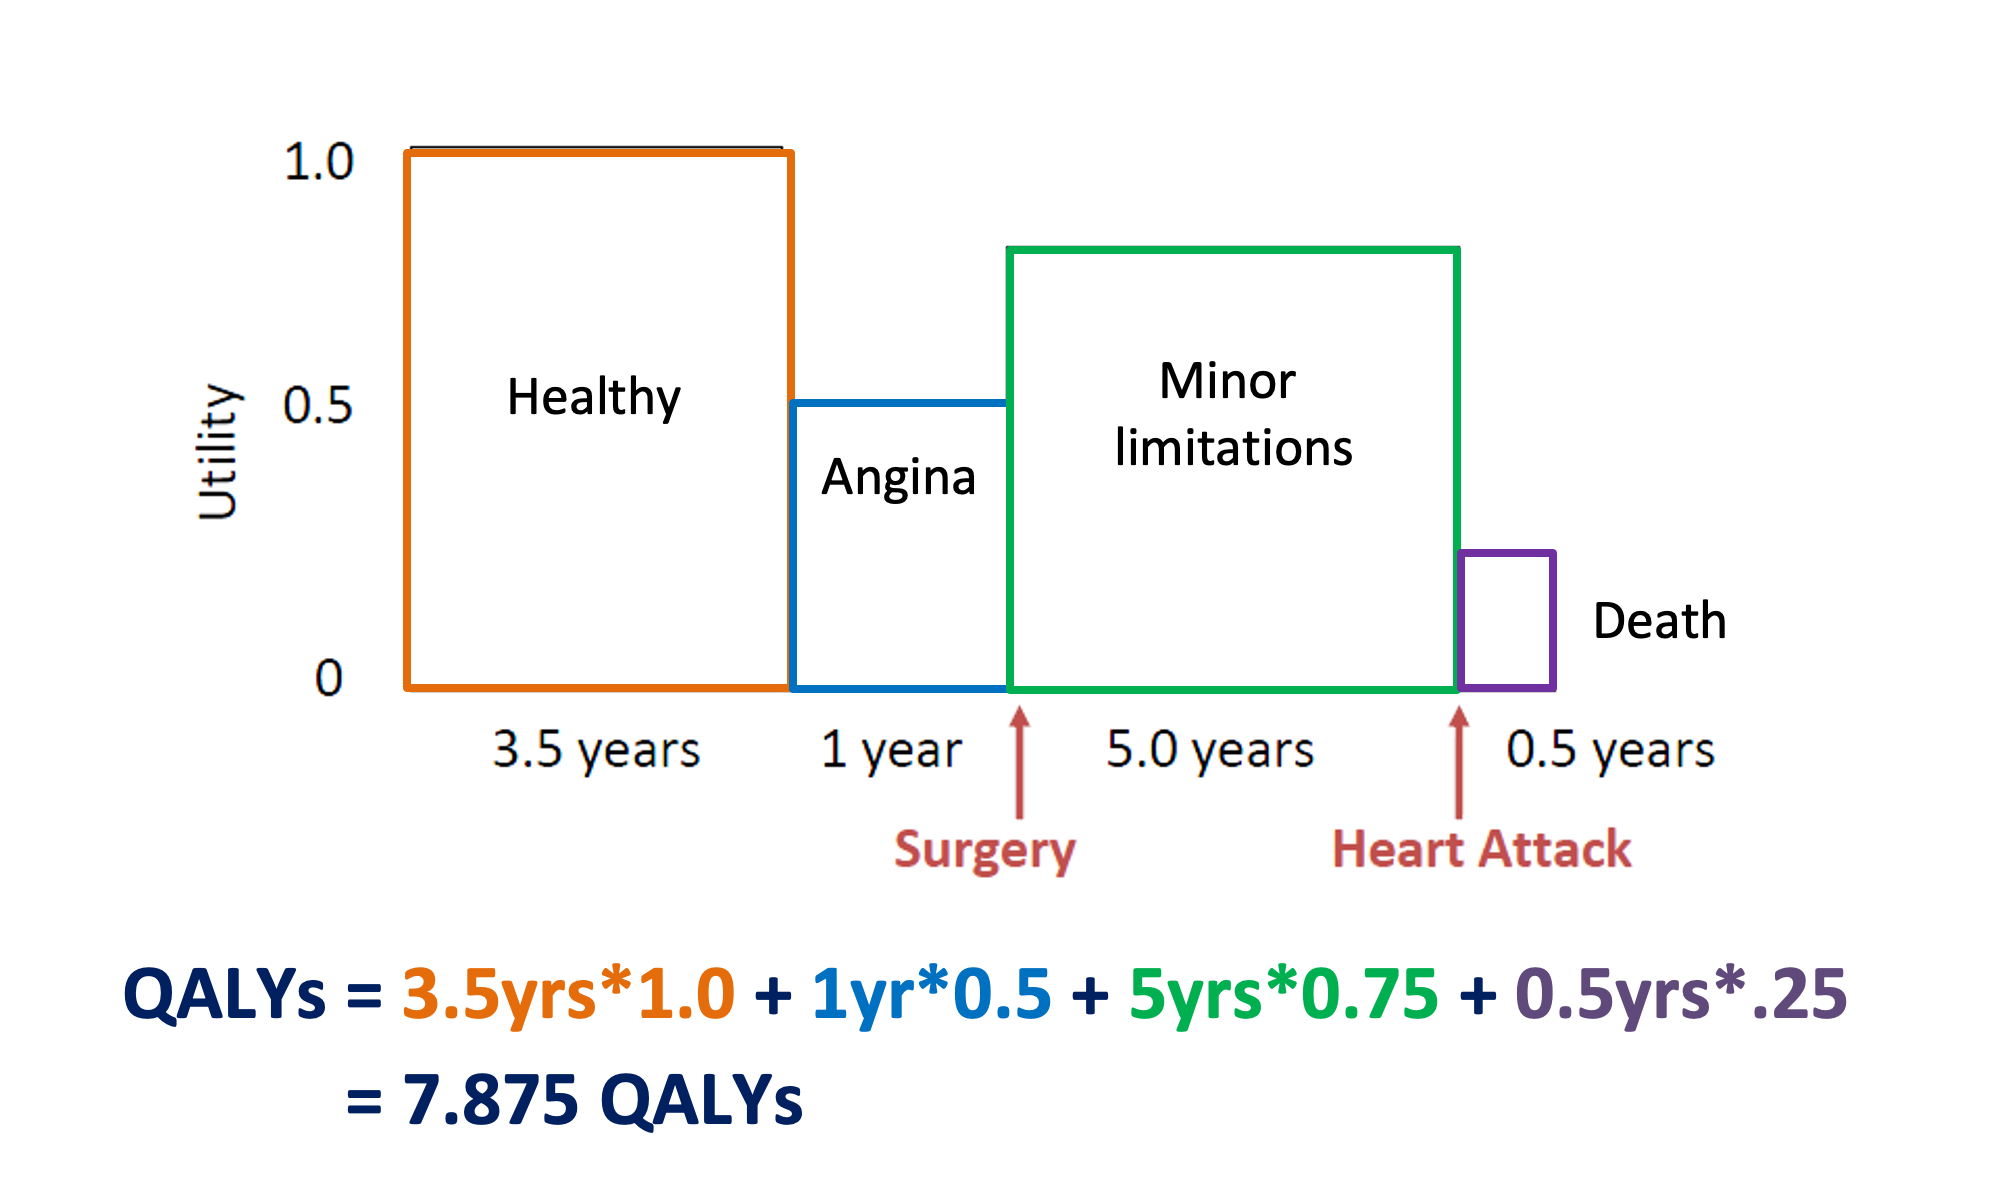
Example: Patient with coronary heart disease (with surgery)
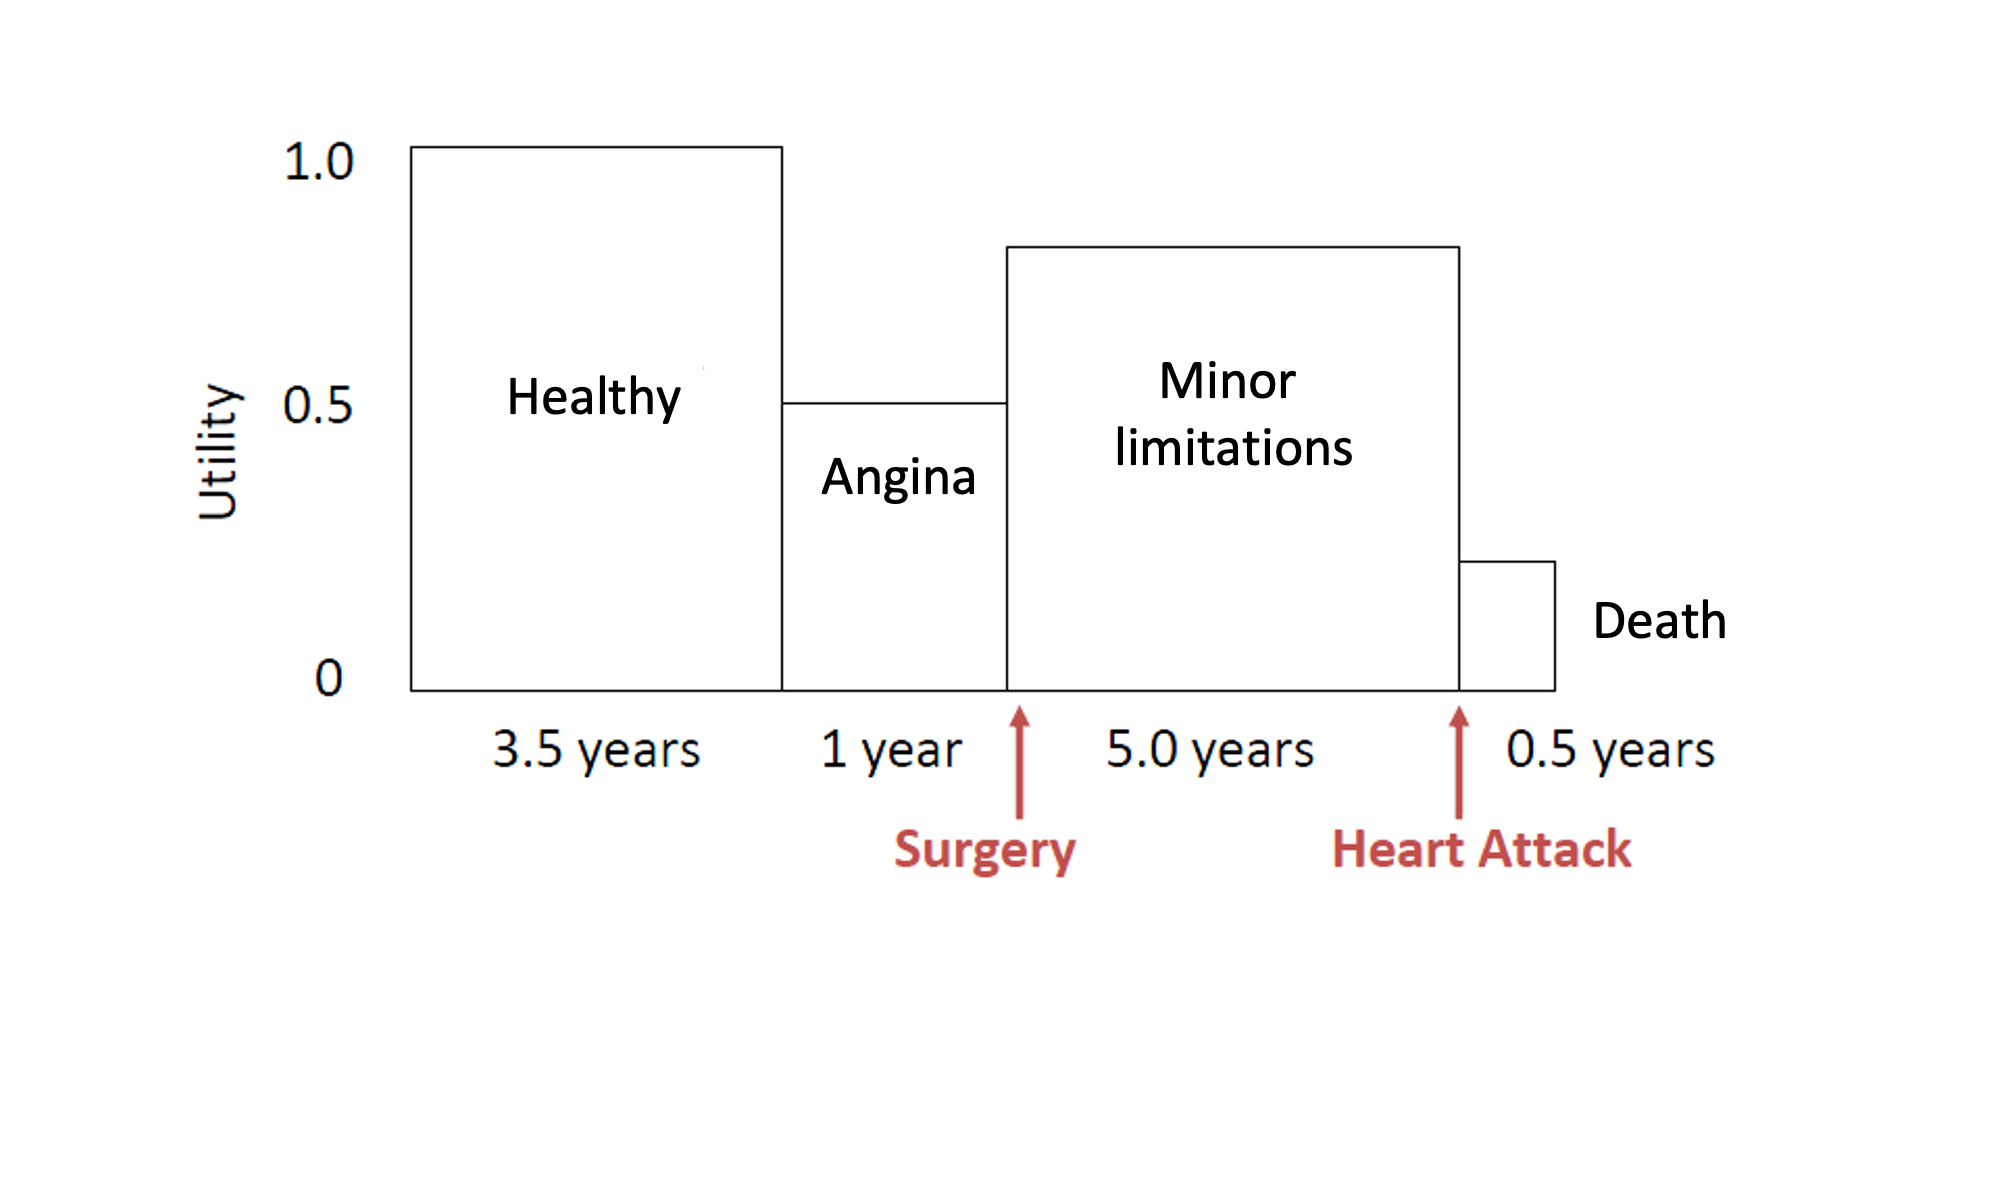
Example: Patient with coronary heart disease (with surgery)
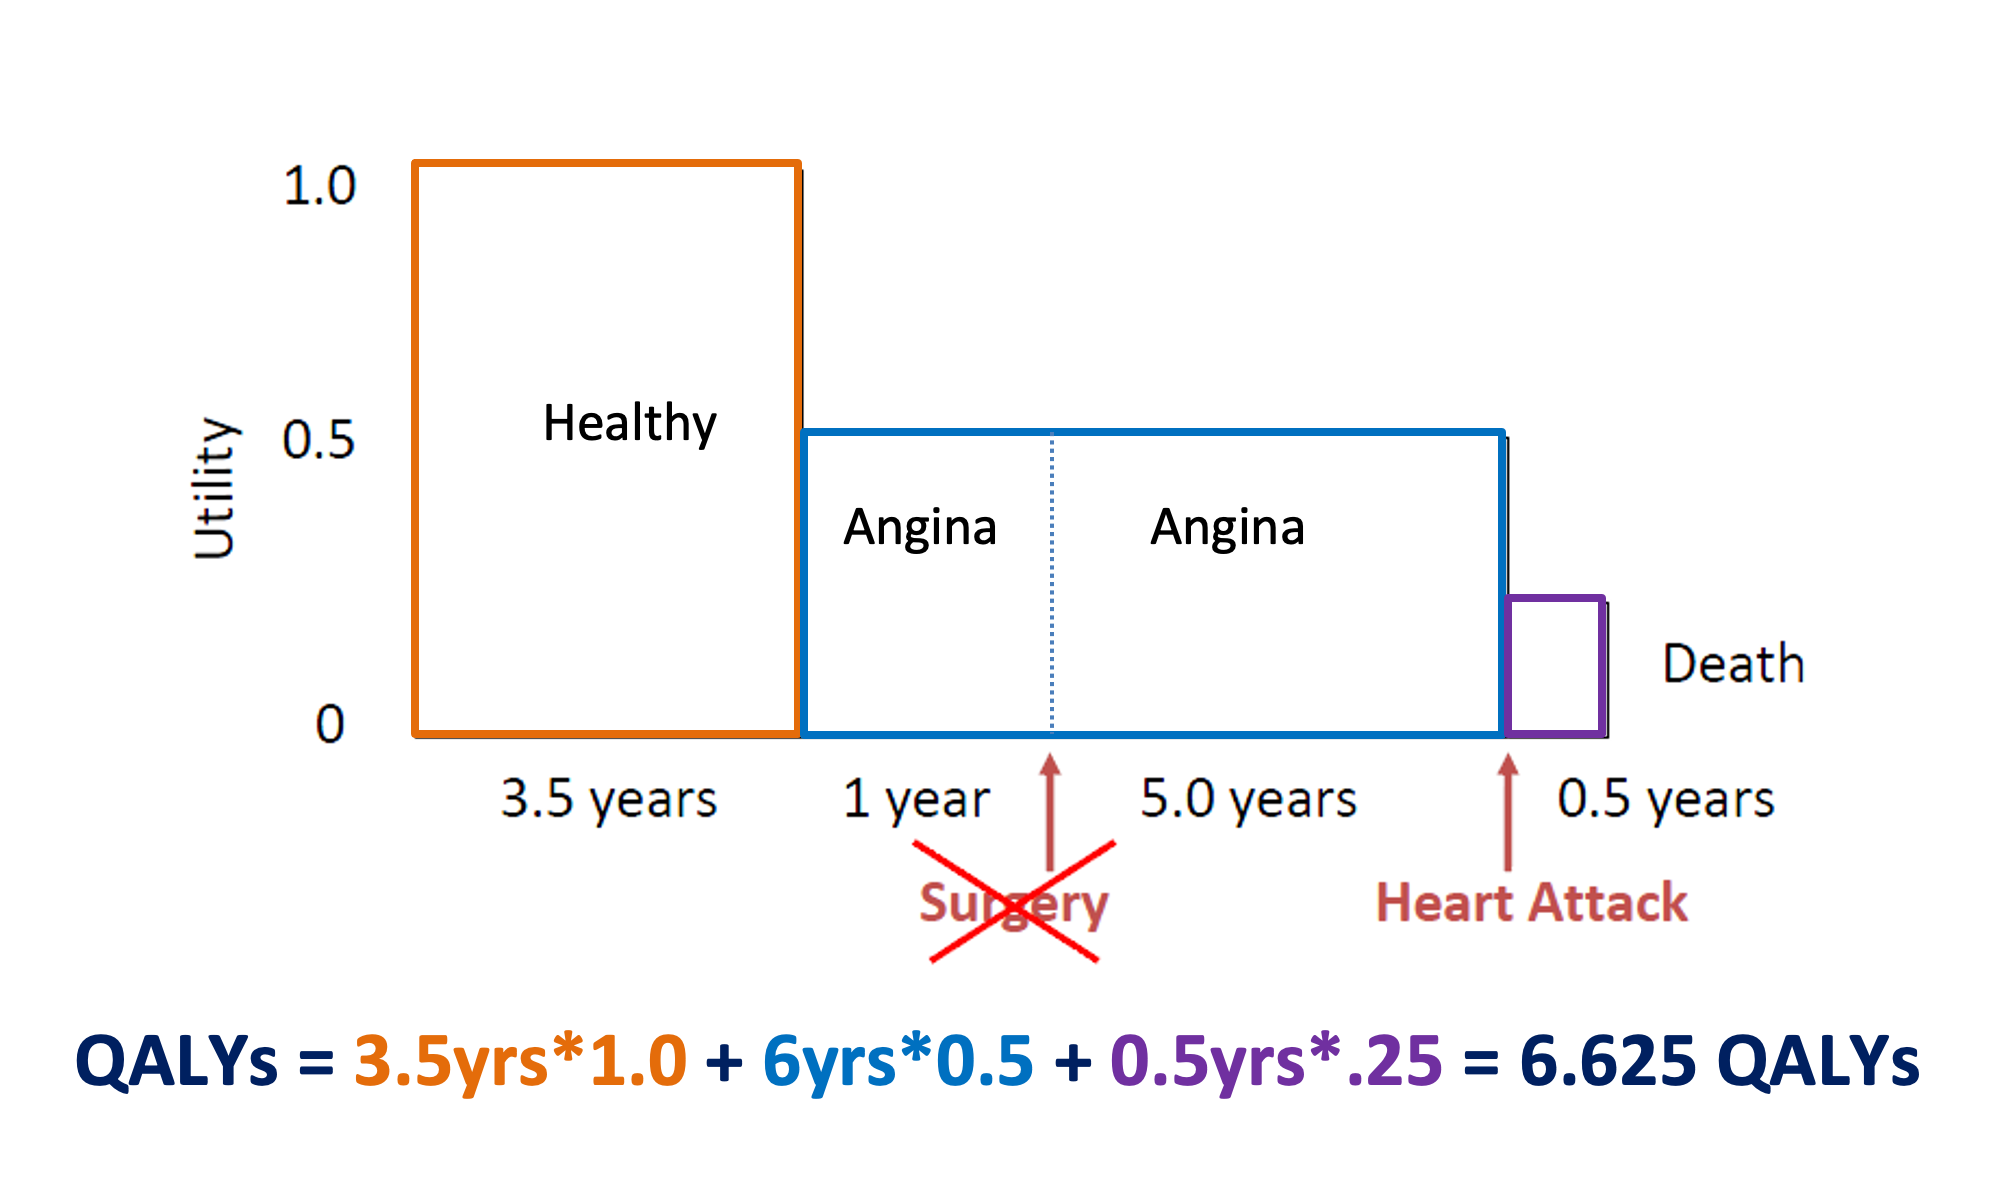
Example: Patient with coronary heart disease (without surgery)
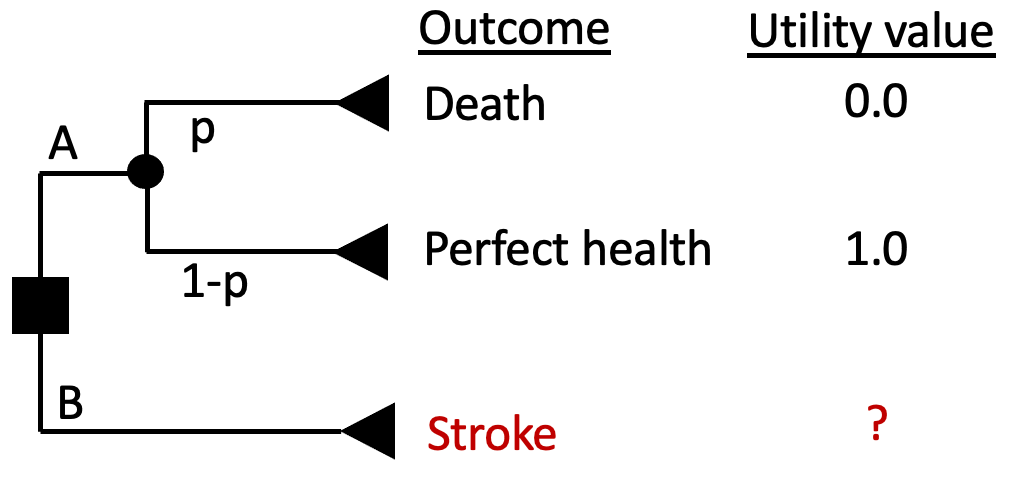
Direct methods - Standard Gamble (SG)
“What risk of death you would accept in order to avoid [living with stroke the rest of your life] and live the rest of your life in perfect health?”
Direct methods - Standard Gamble (SG)
“What risk of death you would accept in order to avoid [living with stroke the rest of your life] and live the rest of your life in perfect health?”
- Find the threshold \(p_T\) that sets EV(A) = EV(B)
- Assume respondent answered that they would be indifferent between A and B at a threshold \(p_T = 0.2\)
- Then U(Stroke) = \(p_T\)*U(Death) + \((1-p_T)\)*U(Perfect Health) = 0.2*0 + (1-0.2)*1 = 0.8
Direct Methods - Time Trade-Off (TTO)
“What portion of your current life expectancy of 40 years would you give up to improve your current health state (stroke) to ‘perfect health’?”
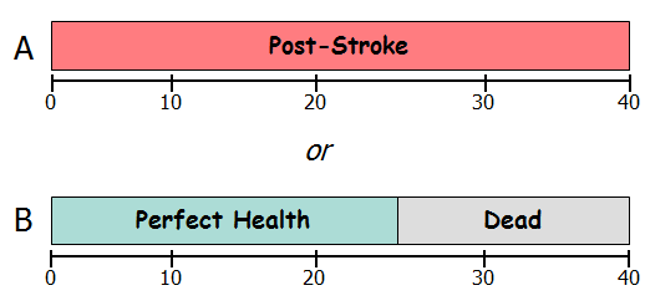
U(Post-Stroke) * 40 years = U(Perfect Health) * 25 years + U(Dead) * 15 years
U(Post-Stroke) * 40 years = 1 * 25 years + 0 * 15 years
U(Post-Stroke) = 25/40 = 0.625
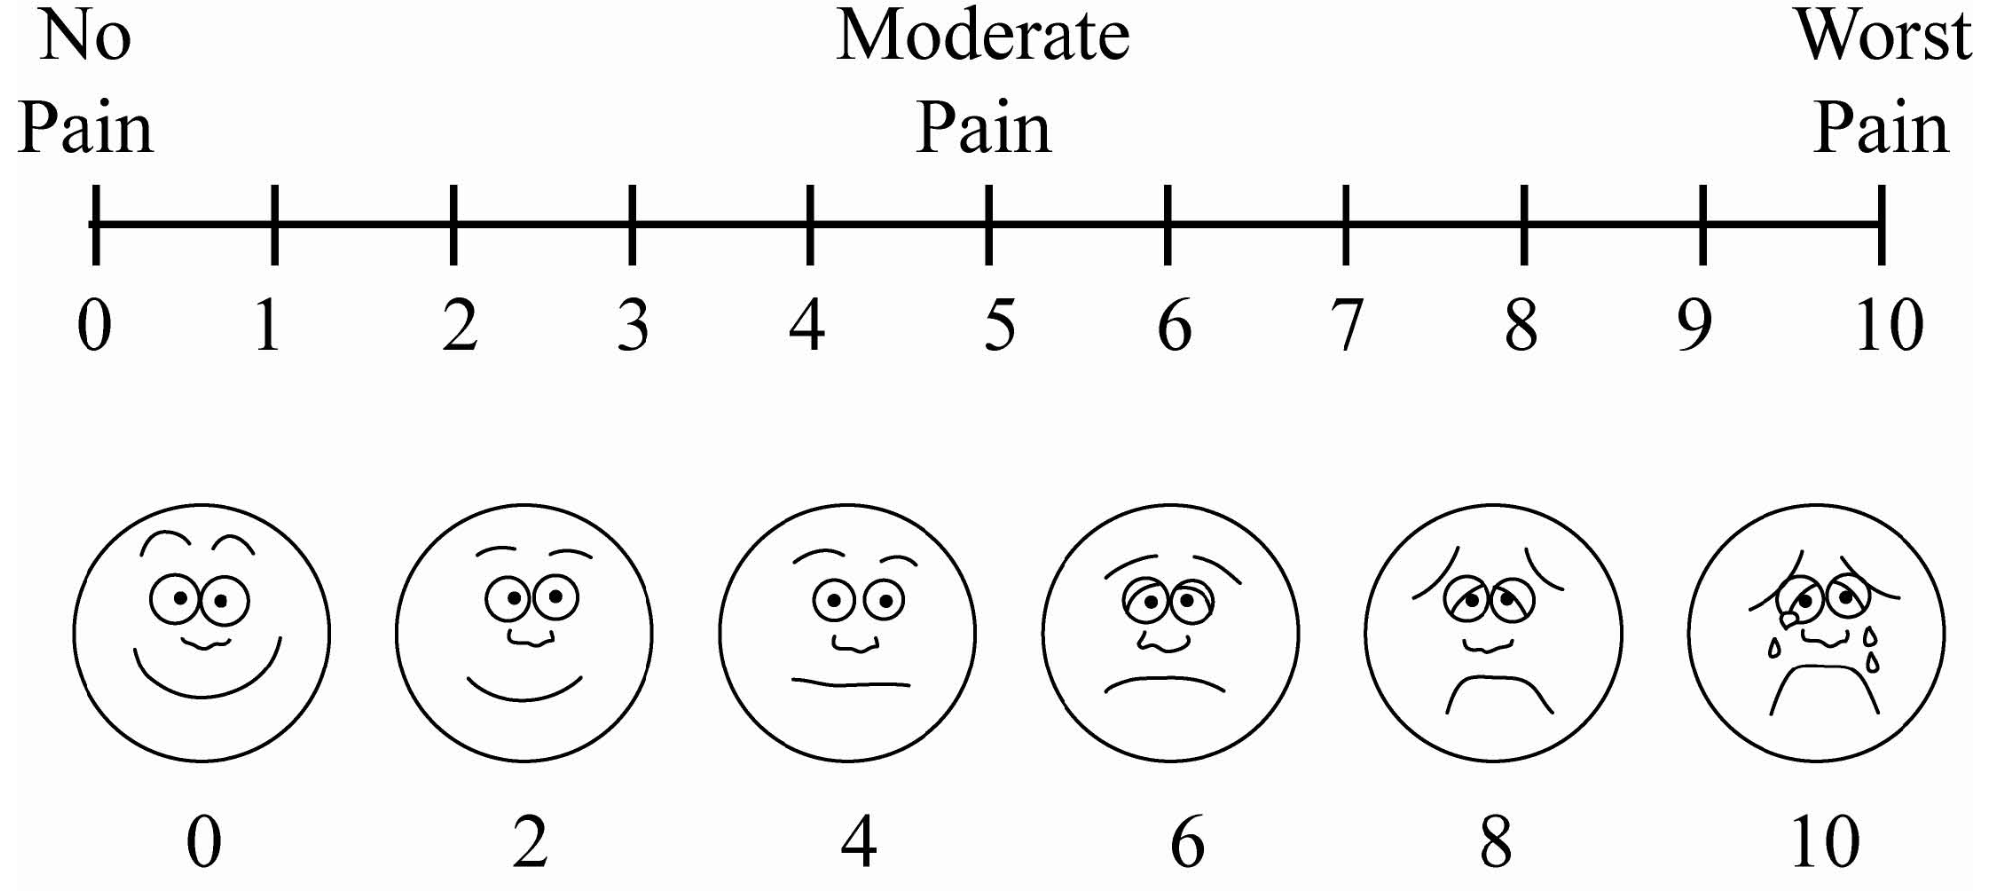
Visual Analogue Scale (VAS)
The Visual Analog Scale (VAS) is a commonly-used rating scale
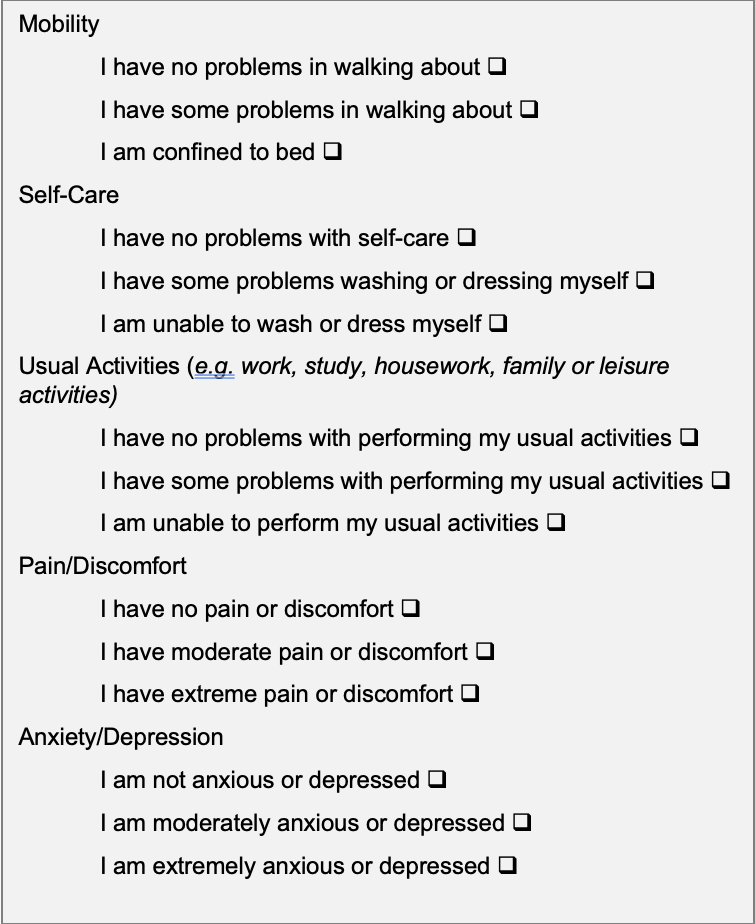
Indirect Methods - EQ-5D
System for describing health states
5 domains: mobility; self-care; usual activities; pain/discomfort; and anxiety/depression
3 levels: 243 distinct health states (e.g. 11223)
Valuations elicited through population based surveys with VAS, TTO
System for describing health states
5 domains: mobility; self-care; usual activities; pain/discomfort; and anxiety/depression
3 levels: 243 distinct health states (e.g. 11223)
Valuations elicited through population based surveys with VAS, TTO
DALYs

DALYs = YLL + YLD
- YLL (Years of Life Lost)
- YLD (Years Lived with Disability)
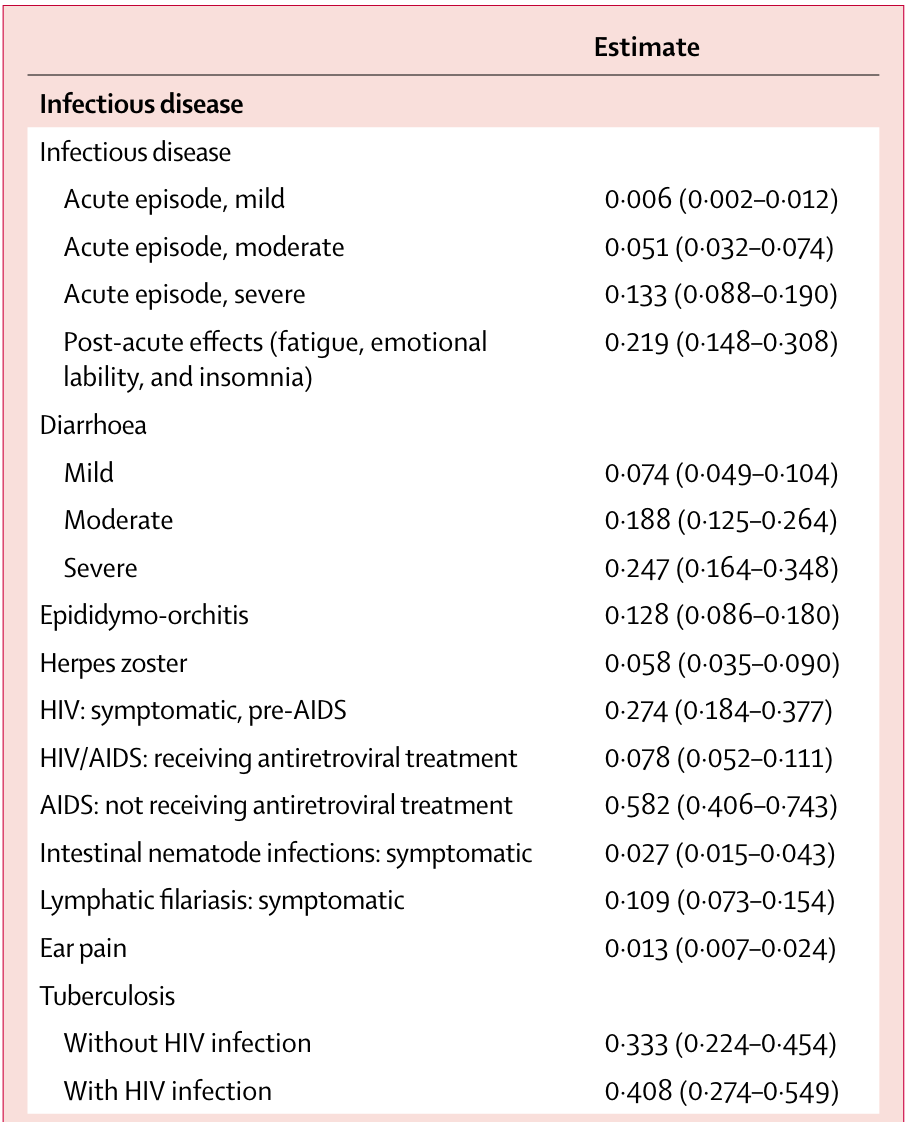
Disability Weights
- Common values for small set of named health conditions (e.g. early/late HIV, HIV/ART)
- First iteration: expert opinion
- Second iteration: Pop-based HH surveys in several world regions (13,902 respondents)
Paired comparison of two health state descriptions which worse
Probit regression to calculate disability weights
235 unique health states
Whose perspective?
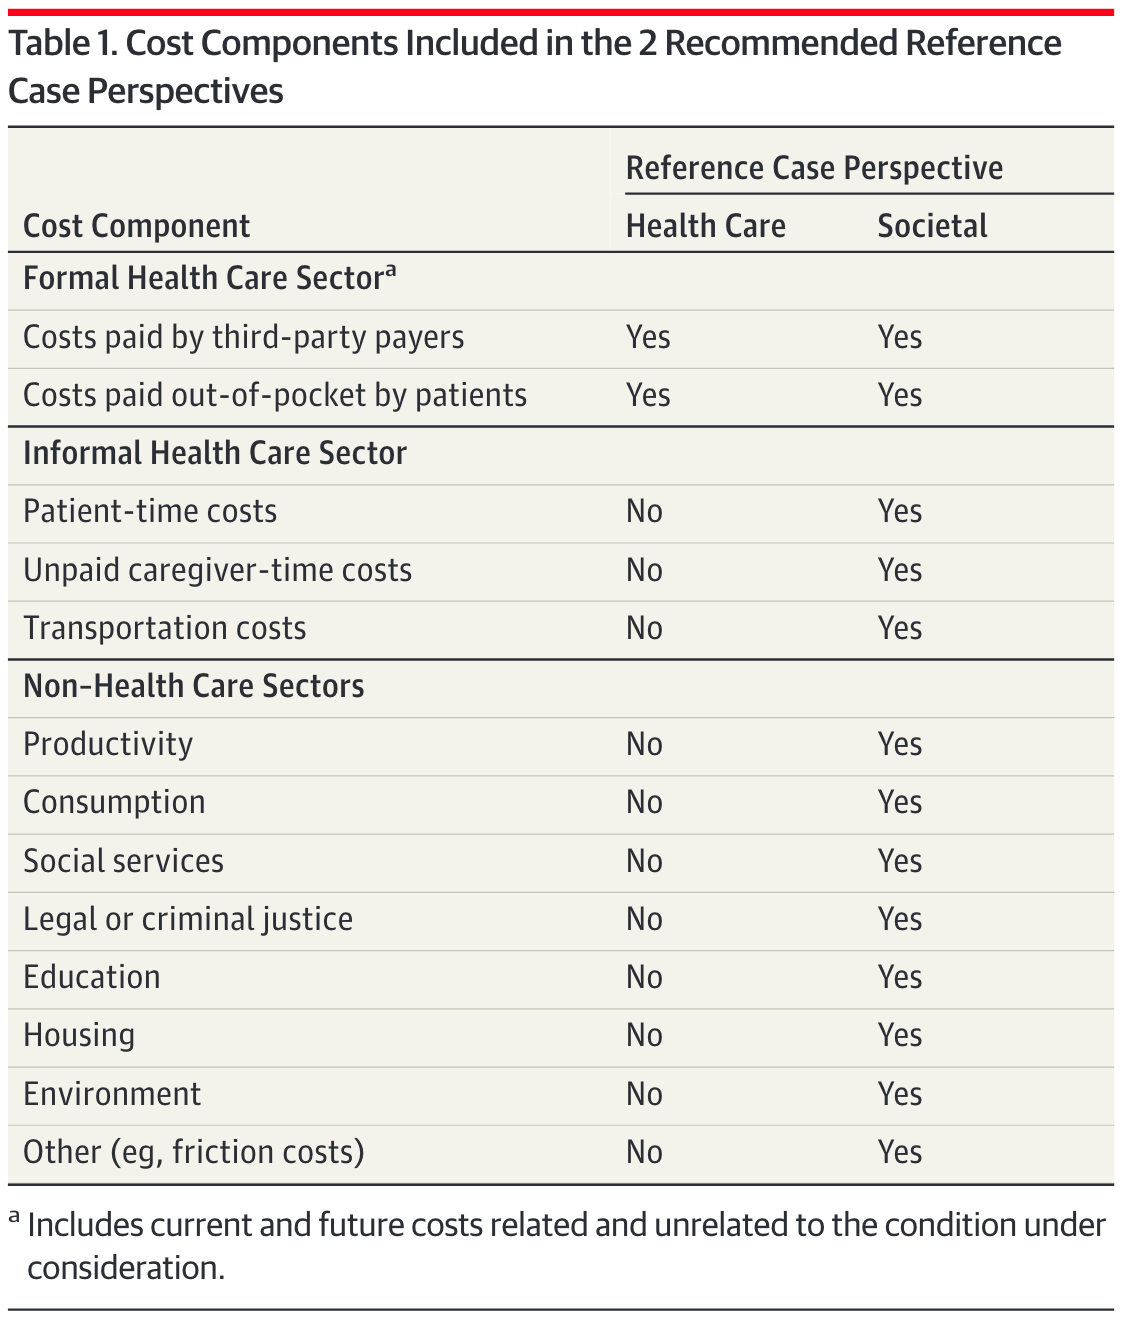
Sanders GD, Neumann PJ, Basu A, et al. Recommendations for Conduct, Methodological Practices, and Reporting of Cost-effectiveness Analyses: Second Panel on Cost-Effectiveness in Health and Medicine. JAMA. 2016;316:1093–1103.