Workshop Blog
Health Economics Modeling Workshop
Slides
Welcome and Introductions
1. Conceptual and theoretical frameworks for decision modeling
2. Foundations of economic evaluation
3. Incremental cost-effectiveness anlaysis
4. Introduction to Markov Modeling
5. Structuring the Markov Model
Group Exercise - Populating a Markov Model
Group Exercise Answer - Populating a Markov Model
6. Curating model parameters
7. Summarizing model outputs
8. Deterministic & Scenario Analysis
9. Systematic Approaches to Understanding Model Uncertainty
11. Decision Criteria and Stakeholder Dissemination
10. Advanced Modeling Techniques
Brainstorm: Dissemination Strategy
Case Studies
Case Study 1: Examples of Decision Analysis
Case Study 2: Construct a Markov Trace
Case Study 3: Constructing a Transition Probability Matrix from Input Parameters
Case Study 4: Summarizing Model Outputs
Case Study 5: Deterministic Sensitivity Analysis
Group Case Study 6: Probabilistic Sensitivity Analysis
Case Study 7: Age-Varying Mortality
SIR Models in Excel
Capstone Exercises
Capstone Exercise
Capstone Powerpoint Template
Tools and Applications
Workshop CEA Shiny Application
Gompertz Mortality Parameters Fit to UN Life Table Data
Decision Tree Drawing Tool
Mermaid Live Editor (Facilitates easy model diagram drawing)
Graphviz Visual Editor
Markov Modeling in R (YouTube Video Series)
Markov Modeling in R
Workshop Blog
Instructors and Participants
Categories
All
(6)
Health Economics Workshop Blog
Additional content and tips
Modeling Mortality Using a Gompertz Model
This document outlines how to model mortality using a gompertz model fit to life table data.
Embedding A Transition Probability Matrix for a Discrete Time Markov Model
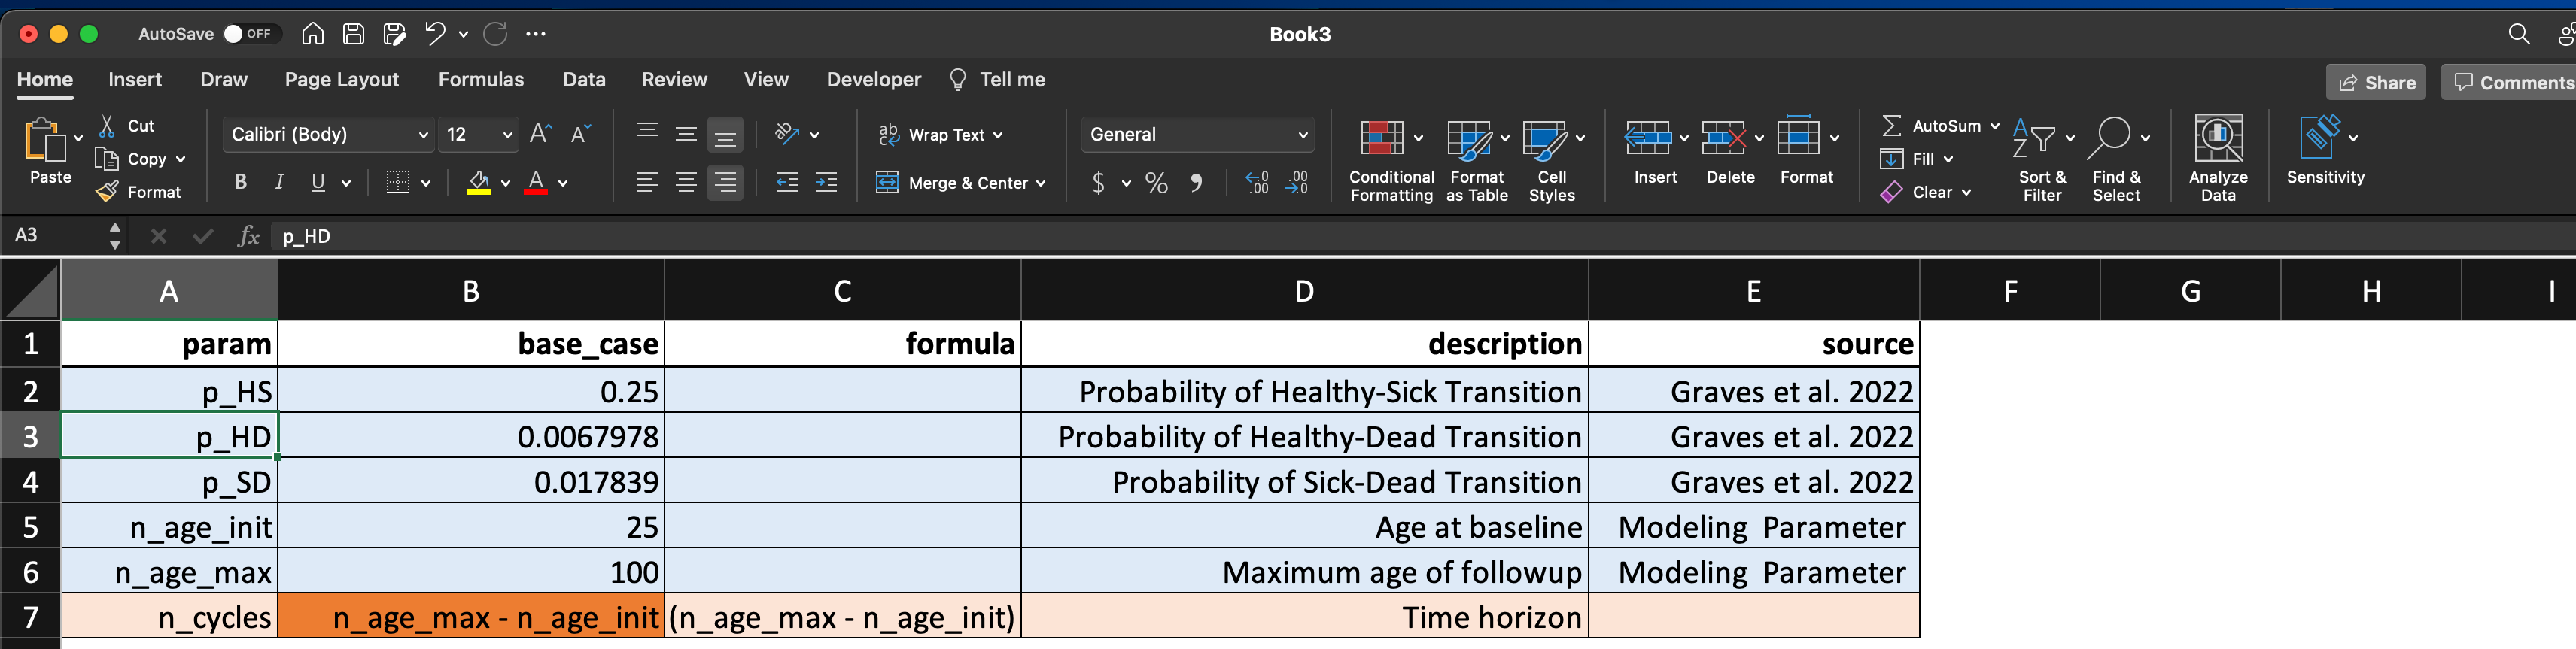
Define
r
H
S
and
r
H
D
as the hazard rate of two independent competing risks from a given (Healthy) health state (to Sick and Dead, respectively), and
Δ
t
the cycle length…
Time- and Country/Region-Varying Transition Probabilities
Another problem that occurs is that of non-stationary rates. What if a rate is changing over an interval time step? How is this best modeled? A…
Probabilistic Sensitivity Analysis Sampling
The objective of this posting is to demonstrate the process and intution of drawing probabilistic sensitivity anlaysis (PSA) samples.
Learning Objectives
-Construct and solve a decision problem by calculating an intervention’s expected value across competing strategies in a decision tree
-Determine the decision threshold across a range of scenarios -Differentiate between joint and conditional probabilities…
An Overview of Excel Functions and Tools for Decision Modeling
This document is designed to provide some useful Excel functions for doing decision analyses.
Sep 19, 2022
No matching items